Background: Treatment-resistant depression (TRD) poses a substantial burden to health care payers including employers, costing an estimated $29 billion-$48 billion yearly in the United States. Furthermore, variation of burden across increasing levels of resistance and the potential impact of TRD on employment status remain largely unexplored.
Objective: To evaluate health care resource utilization (HRU) and costs, work loss, indirect costs, and employment status change in TRD.
Methods: A claims-based algorithm identified adults with TRD from a US claims database of privately insured employees and dependents (January 2010-March 2015). TRD patients were matched 1:1 on demographics to patients with major depressive disorder (MDD) (non-TRD MDD) and without MDD (non-MDD), who were identified using ICD-9-CM codes. Costs, HRU, and employment status change were compared over 2 years following the first antidepressant (randomly imputed date for non-MDD), adjusting for baseline comorbidity index and costs.
Results: TRD patients (N = 6,411) had more HRU than either matched control cohort, translating into higher per patient per year (PPPY) health care costs: $6,709 and $9,917 more than non-TRD MDD and non-MDD patients, respectively (P < .001 for both). TRD patients with work loss data (N = 1,908) had 35.8 work loss days PPPY (1.7 and 6.2 times the work loss rate in non-TRD MDD and non-MDD patients, respectively). Work loss-related costs in TRD patients were $1,811 higher than non-TRD MDD and $3,460 higher than in non-MDD patients (P < .001). TRD patients had 1.3-1.4 times the rate of employment status change versus control cohorts (all P < .05).
Conclusions: TRD, even compared to MDD, poses a significant direct and indirect cost burden to US employers and may be associated with higher rates of employment status change.
This work may not be copied, distributed, displayed, published, reproduced, transmitted, modified, posted, sold, licensed, or used for commercial purposes. By downloading this file, you are agreeing to the publisher’s Terms & Conditions.

ABSTRACT
Background: Treatment-resistant depression (TRD) poses a substantial burden to health care payers including employers, costing an estimated $29 billion-$48 billion yearly in the United States. Furthermore, variation of burden across increasing levels of resistance and the potential impact of TRD on employment status remain largely unexplored.
Objective: To evaluate health care resource utilization (HRU) and costs, work loss, indirect costs, and employment status change in TRD.
Methods: A claims-based algorithm identified adults with TRD from a US claims database of privately insured employees and dependents (January 2010-March 2015). TRD patients were matched 1:1 on demographics to patients with major depressive disorder (MDD) (non-TRD MDD) and without MDD (non-MDD), who were identified using ICD-9-CM codes. Costs, HRU, and employment status change were compared over 2 years following the first antidepressant (randomly imputed date for non-MDD), adjusting for baseline comorbidity index and costs.
Results: TRD patients (N = 6,411) had more HRU than either matched control cohort, translating into higher per patient per year (PPPY) health care costs: $6,709 and $9,917 more than non-TRD MDD and non-MDD patients, respectively (P < .001 for both). TRD patients with work loss data (N = 1,908) had 35.8 work loss days PPPY (1.7 and 6.2 times the work loss rate in non-TRD MDD and non-MDD patients, respectively). Work loss-related costs in TRD patients were $1,811 higher than non-TRD MDD and $3,460 higher than in non-MDD patients (P < .001). TRD patients had 1.3-1.4 times the rate of employment status change versus control cohorts (all P < .05).
Conclusions: TRD, even compared to MDD, poses a significant direct and indirect cost burden to US employers and may be associated with higher rates of employment status change.
J Clin Psychiatry 2018;79(2):17m11725
To cite: Amos TB, Tandon N, Lefebvre P, et al. Direct and indirect cost burden and change of employment status in treatment-resistant depression: a matched-cohort study using a US commercial claims database. J Clin Psychiatry. 2018;79(2):17m11725.
To share: https://doi.org/10.4088/JCP.17m11725
© Copyright 2018 Physicians Postgraduate Press, Inc.
aJanssen Scientific Affairs, LLC, Titusville, New Jersey
bAnalysis Group Inc, Montréal, Québec, Canada
cAnalysis Group, Inc, Boston, Massachusetts
*Corresponding author: Dominic Pilon, MA, Analysis Group, Inc, 1000 De La Gauchetiרre West, Ste 1200, Montréal, QC H3B 4W5 ([email protected]).
Major depressive disorder (MDD) affects nearly 9% of the US population1-3 and carries an estimated burden of $210.5 billion in the United States.3-7 Nearly half of this impact is attributable to direct medical expenses, with the remainder borne in the workplace through absenteeism and presenteeism and in the labor market more generally through changes in the employment status and suicidality.5,8-12 As the second leading cause of disability worldwide, MDD also presents a serious burden for patients and their caregivers,13 translating, on average, into over 8 hours per week of lost productivity14 and lower personal earnings and household income15 than for depression-free patients. Although effective treatments are associated with reduced symptoms, health care resource utilization (HRU), and costs, approximately half of MDD patients do not respond to their first antidepressant therapy, a significant proportion of whom do not benefit from multiple lines of therapy, thus progressing to treatment-resistant depression (TRD).16-22 While there is no universally accepted TRD definition, it is most frequently defined as MDD in patients who have not responded adequately to at least 2 different antidepressants of adequate dose and duration.19
TRD accounts for a large share of the MDD burden, estimated at $29 billion-48 billion annually in direct health care and indirect work loss-related costs in the United States.17 Cost-of-illness studies have shown that compared to patients with MDD, those with TRD have 2 to 3 times greater direct and indirect HRU and costs.23-30 Furthermore, costs within the TRD population most likely increase with the number of treatment failures.23,25,26,29,30
While there is a well-established relationship between TRD and increased depression severity, less is known about the burden of TRD on important life outcomes such as employment changes and absenteeism. For example, given that depression largely impacts working populations, the higher job-loss rate among TRD patients is of interest.17,31,32 Thus, further research is needed to assess the incremental burden of TRD patients compared to MDD patients without TRD and to patients without MDD.
The study assessed the direct and indirect HRU and costs as well as employment status changes in patients with TRD compared to patients with and without MDD and assessed direct health care costs across increasing levels of treatment resistance (ie, using the number of lines of therapy as a proxy) among patients with TRD.
METHODS
Data Source
The study used health claims from the OptumHealth Care Solutions, Inc database (July 2009-March 2015), which includes data for over 19.1 million privately insured individuals covered by 84 self-insured Fortune 500 companies in the United States. The database contains information on medical claims (eg, payment; International Classification of Diseases, ninth revision [ICD-9] diagnoses; Current Procedural Terminology codes), prescription drug claims (eg, supply days, date of service, National Drug Codes), and eligibility (eg, age, gender, enrollment dates). Data for short- and long-term disability claims, salary data, and employment status (ie, active, terminated, or Consolidated Omnibus Budget Reconciliation Act [COBRA] status) were also available for a subset of patients. Data are deidentified and comply with the patient confidentiality requirements of the Health Insurance Portability and Accountability Act.
Study Design and Cohorts
The study used a retrospective, longitudinal, matched cohort design consisting of 3 mutually exclusive cohorts: (1) TRD patients (TRD cohort), (2) MDD patients without TRD (non-TRD MDD cohort), and (3) patients without MDD (non-MDD cohort).

- The burden of treatment-resistant depression is well documented, but its impact relative to depression alone and its impact on employment are relatively unknown.
- Patients with treatment-resistant depression incur more health care costs and resource use than those without, and that burden increases with the level of resistance.
- Treatment-resistant depression involves a significant indirect burden, including absenteeism and employment status change.
TRD and non-TRD MDD cohorts. To be included in the TRD and non-TRD MDD cohorts, patients were required to meet the following criteria: (a) have at least 1 diagnosis for MDD (ICD-9-CM: 296.2x, 296.3x), (b) have at least 1 claim for an antidepressant starting from January 2010 (defined as the index date) without antidepressant claims 6 months before, (c) have at least 1 diagnosis for depression (ICD-9-CM: 296.2x, 296.3x, 300.4x, 311.x, 309.0x, or 309.1x) at least 6 months prior or after the index date, and (d) have claims for at least 1 antidepressant agent with an adequate dose and duration after the index date. Adequate dose was defined as the minimum starting dose recommended by the American Psychiatric Association treatment guidelines.33 Adequate duration was defined as at least 6 weeks of continuous therapy with no gaps longer than 14 days.
MDD patients were considered to have TRD after 2 antidepressant treatment courses (including augmentation therapy with anticonvulsant, anxiolytic, antipsychotic, lithium, psychostimulant, and thyroid hormone medications; see Supplementary eTables 1 and 2 at PSYCHIATRIST.COM for lists of antidepressant and augmentation medications, respectively) with adequate dose and duration failed to improve their depression. Failure of a treatment course was defined as a switch of antidepressant (no more than 180 days after the end of the previous treatment), the addition of an antidepressant, or the initiation of an augmentation therapy. The initiation of the third antidepressant or augmentation medication defined TRD.
MDD patients not defined as having TRD within 2 years of the index date were considered non-TRD MDD.
Non-MDD cohort. The non-MDD cohort consisted of a random sample of 500,000 patients without an MDD diagnosis at any time. The index date was randomly assigned during January 1, 2010-March 31, 2015.
All cohorts. All patients also had to meet the following criteria: no diagnosis for specific psychiatric comorbidities (ie, psychosis, schizophrenia, bipolar disorder/manic depression, dementia), no Medicare coverage, age of 18 to 64 years at the index date, and at least 6 months of continuous eligibility pre- and post-index date.
Baseline and observation periods. Baseline characteristics were evaluated in the 6 months pre-index date (baseline period), while outcomes were evaluated from the index date up to the earliest of 2 years post-index date, the end of continuous eligibility, or the end of data availability (observation period).
Study Outcomes
Treatment patterns included antidepressant and mental health-related medication use and antidepressant therapy duration.
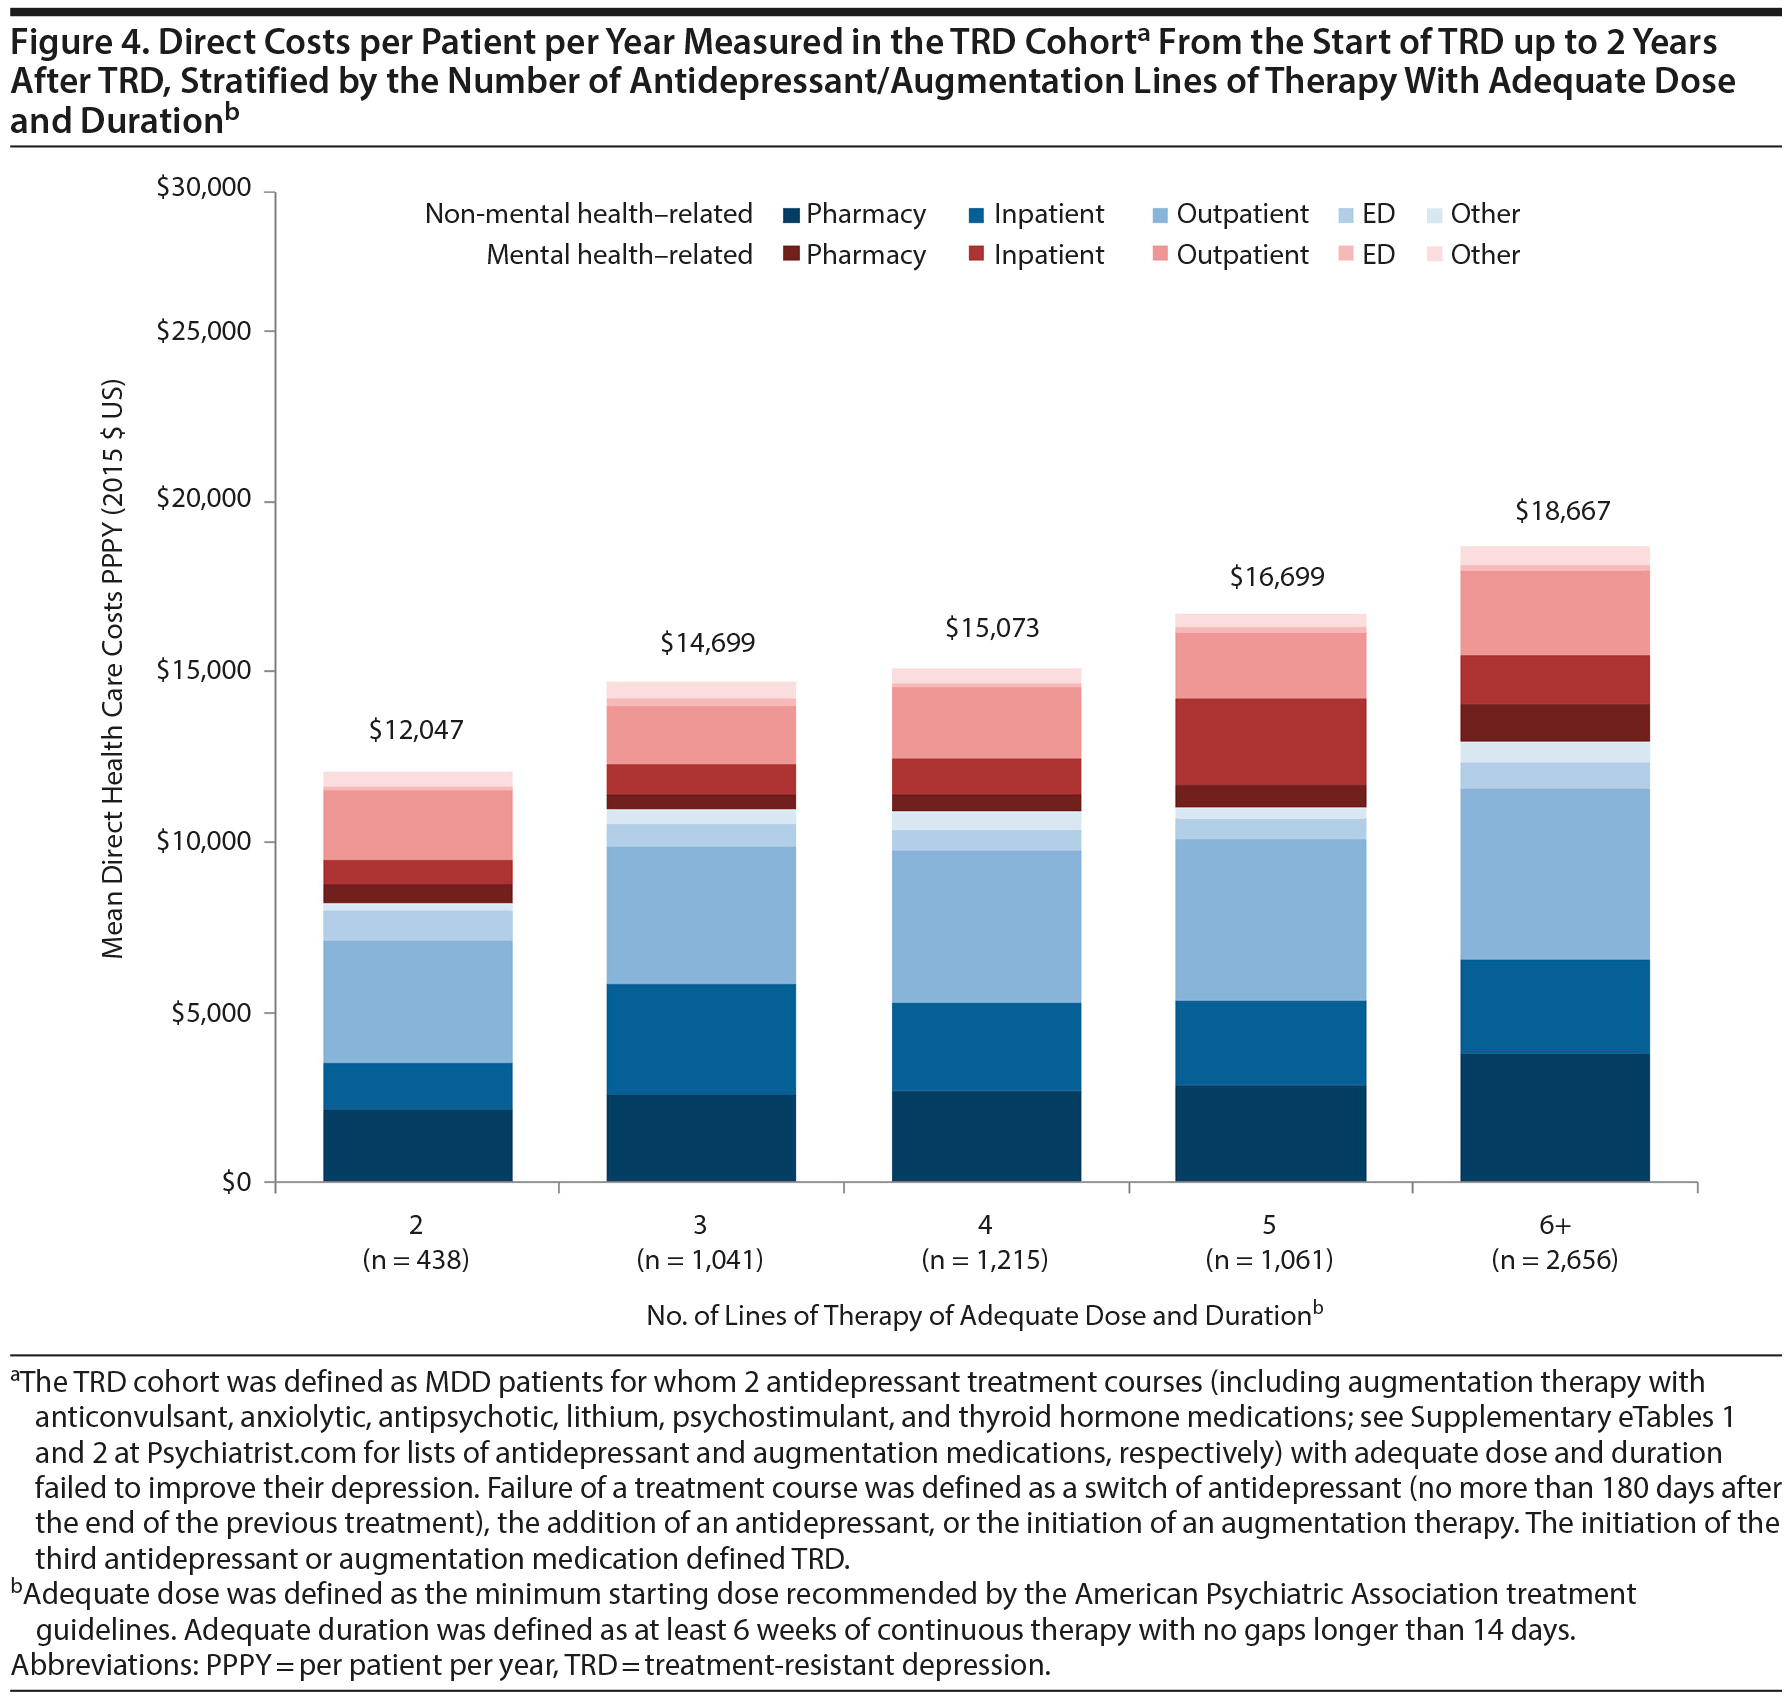
Direct HRU and costs consisted of all-cause, mental health-related, and depression-related components reported overall and by type (ie, inpatient, emergency department [ED], outpatient, and other [eg, medical ancillary services]). Direct health care costs among TRD patients were also measured from the start of TRD up to 2 years post-TRD and stratified by the number of lines of therapy with adequate dose and duration.
Indirect work loss-related HRU included the number of total work loss days, medical-related absenteeism days (ie, a full day for inpatient visits and a half day for ED, outpatient, and other visits), and disability days. Indirect work loss-related costs included medical-related absenteeism costs (imputed from absenteeism days and wage) and disability costs among primary plan holders with work loss data.
Time to employment status change was defined as the time from the index date to employment termination or COBRA status and was censored at the end of eligibility or the end of data availability. COBRA enables individuals who meet certain requirements to continue receiving coverage after they would otherwise become ineligible (eg, due to termination or reduced hours) at the full expense to the employee for the plan premiums. Since both termination and COBRA status represent changes in employment status, a composite outcome of either termination or COBRA status was also assessed. As exploratory outcomes, direct health care costs were assessed pre- and post-COBRA in TRD and non-TRD MDD cohorts.
Statistical Analysis
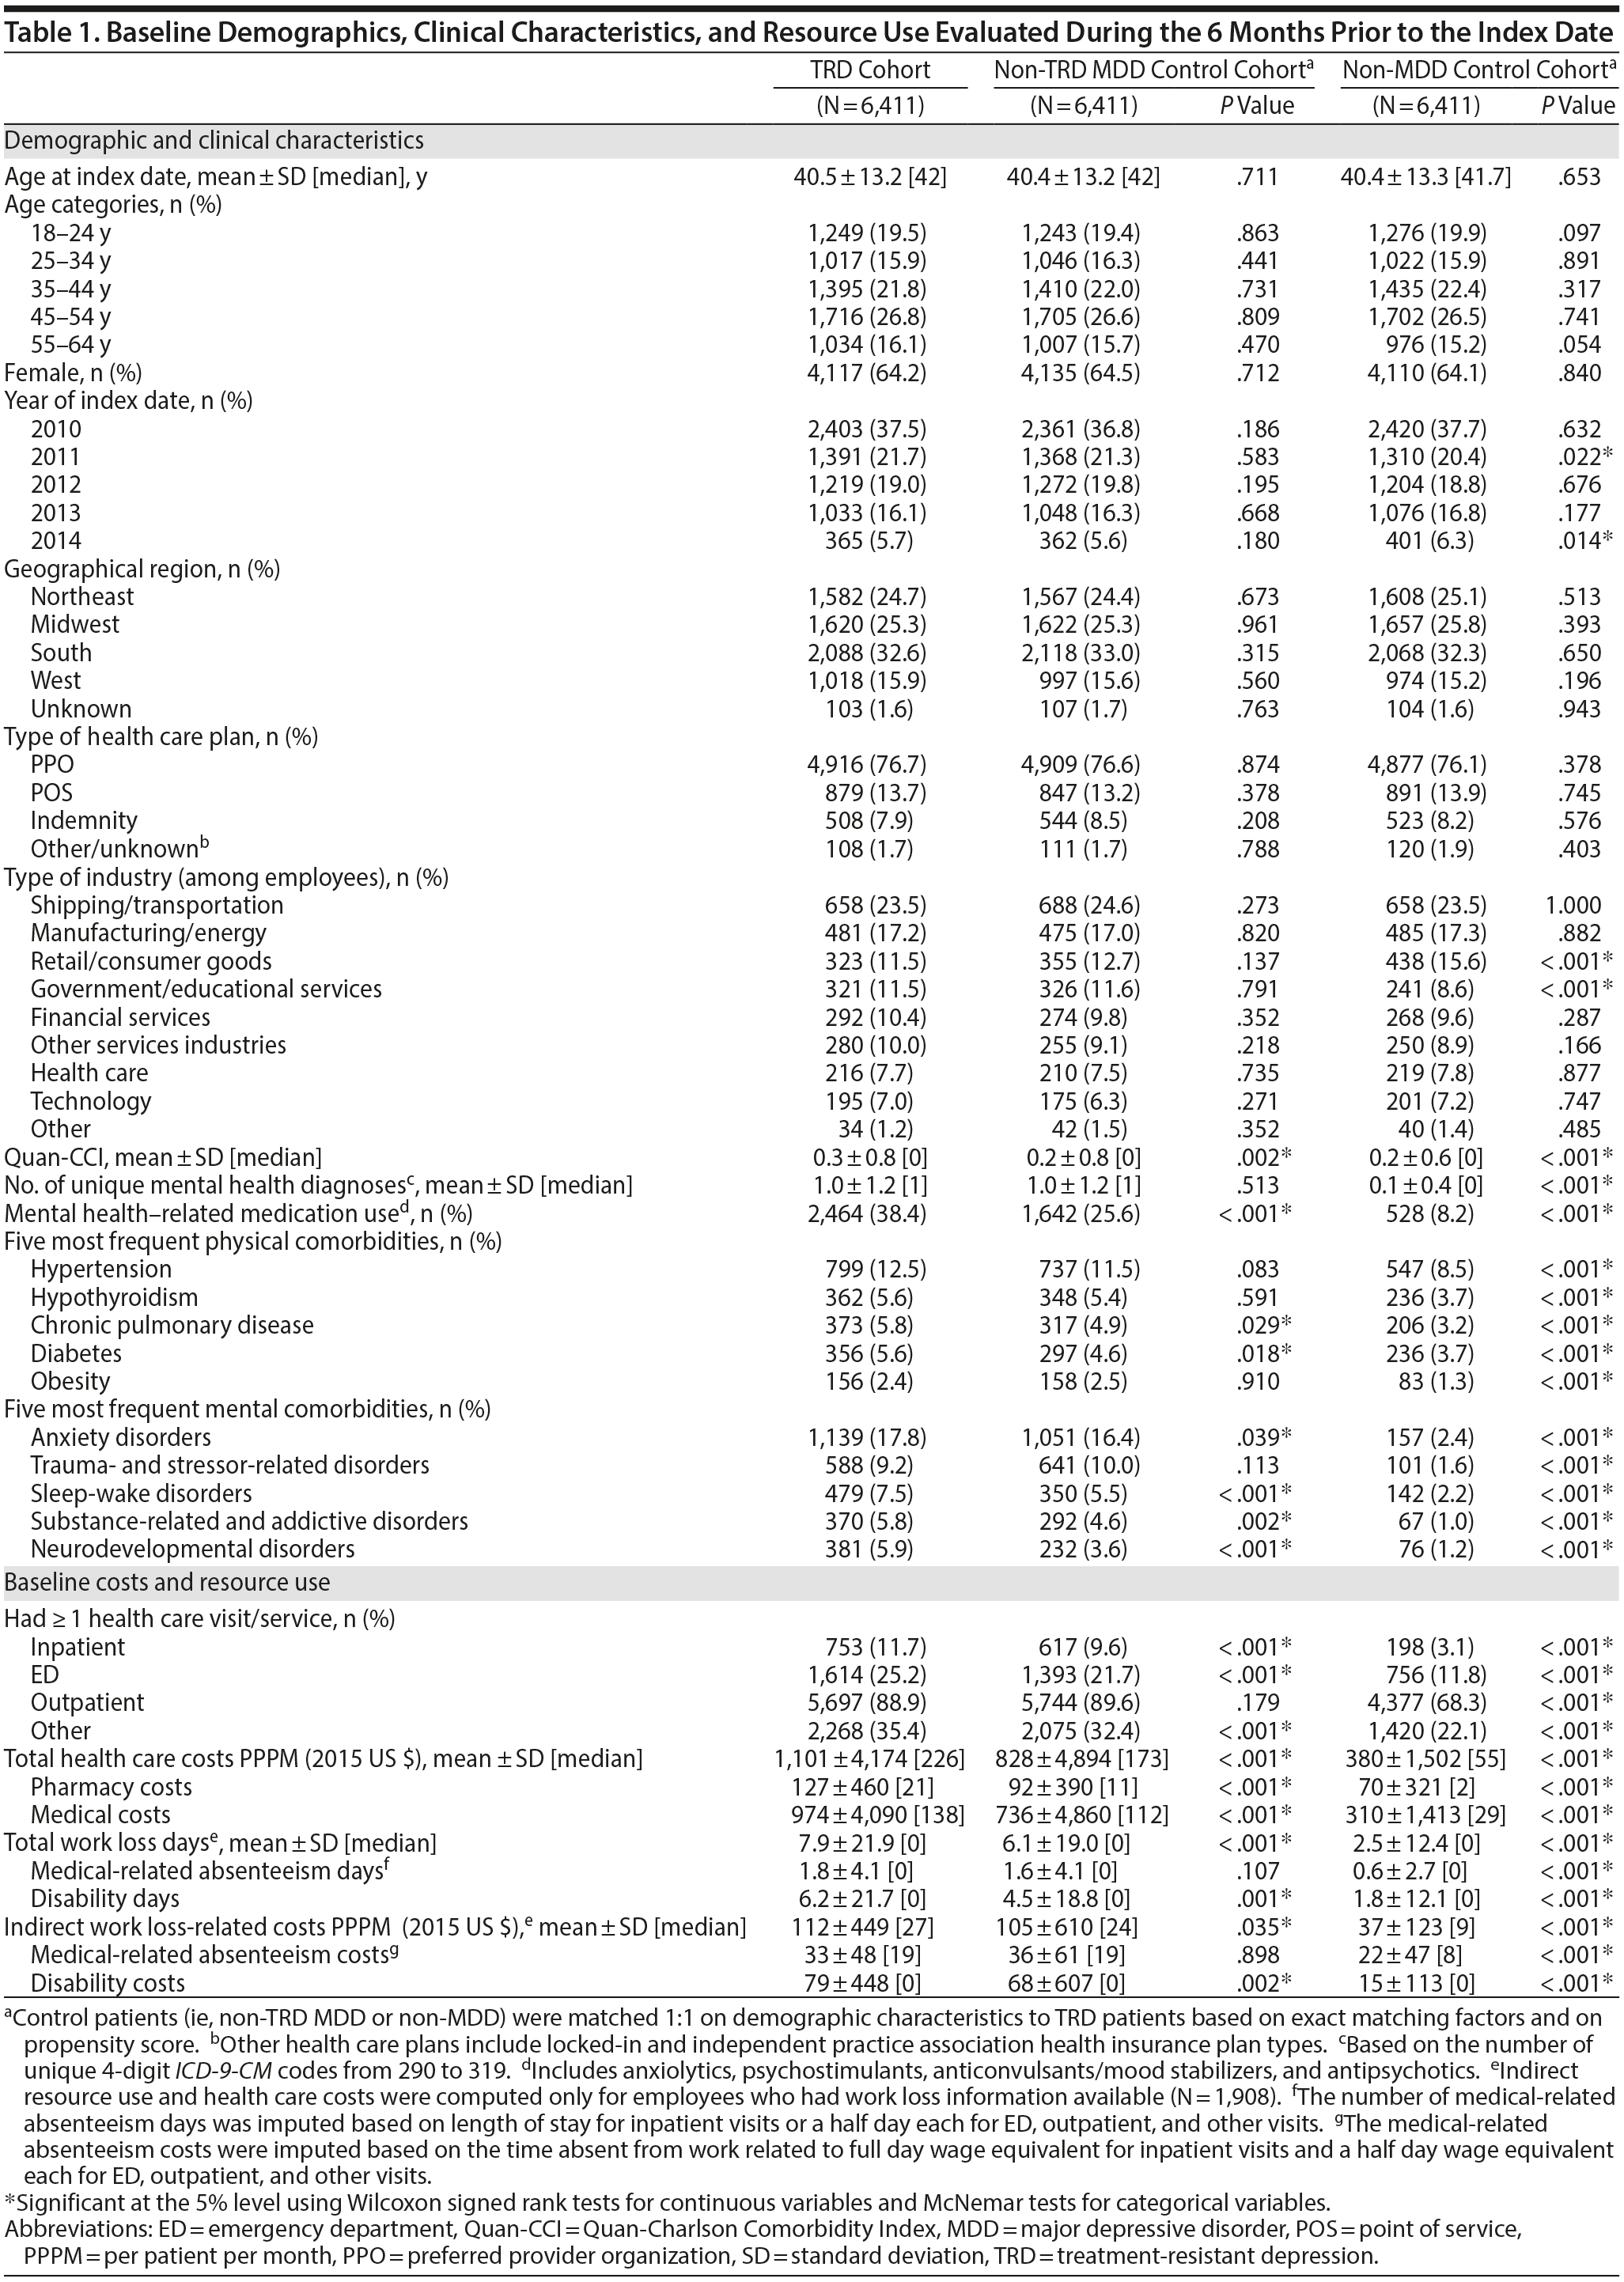
To control for potential confounding, the 2 control cohorts were matched 1:1 to the TRD cohort on the relationship to plan holder (ie, primary or dependent), work loss data availability, and a propensity score (modeled using logistic regression controlling for age, sex, year of the index date, region, and health care plan type).
Baseline characteristics were compared between cohorts using McNemar tests for categorical and Wilcoxon signed rank tests for continuous variables. HRU was compared using multivariate negative binomial or Poisson regression based on overdispersion tests and reported using incidence rate ratios. Costs (2015 US $) were expressed per patient per month (PPPM) or year (PPPY) using means, standard deviations (SDs), and medians and were compared using multivariate ordinary least squares regression (ie, cost differences). Multivariate models adjusted for baseline total health care costs and Quan-Charlson Comorbidity Index (Quan-CCI),34 with confidence intervals (CIs) and P values for cost outcomes obtained from a nonparametric bootstrap procedure (499 replications). Employment status change was compared using univariate Cox proportional hazards regression (ie, hazard ratios [HRs]).
RESULTS
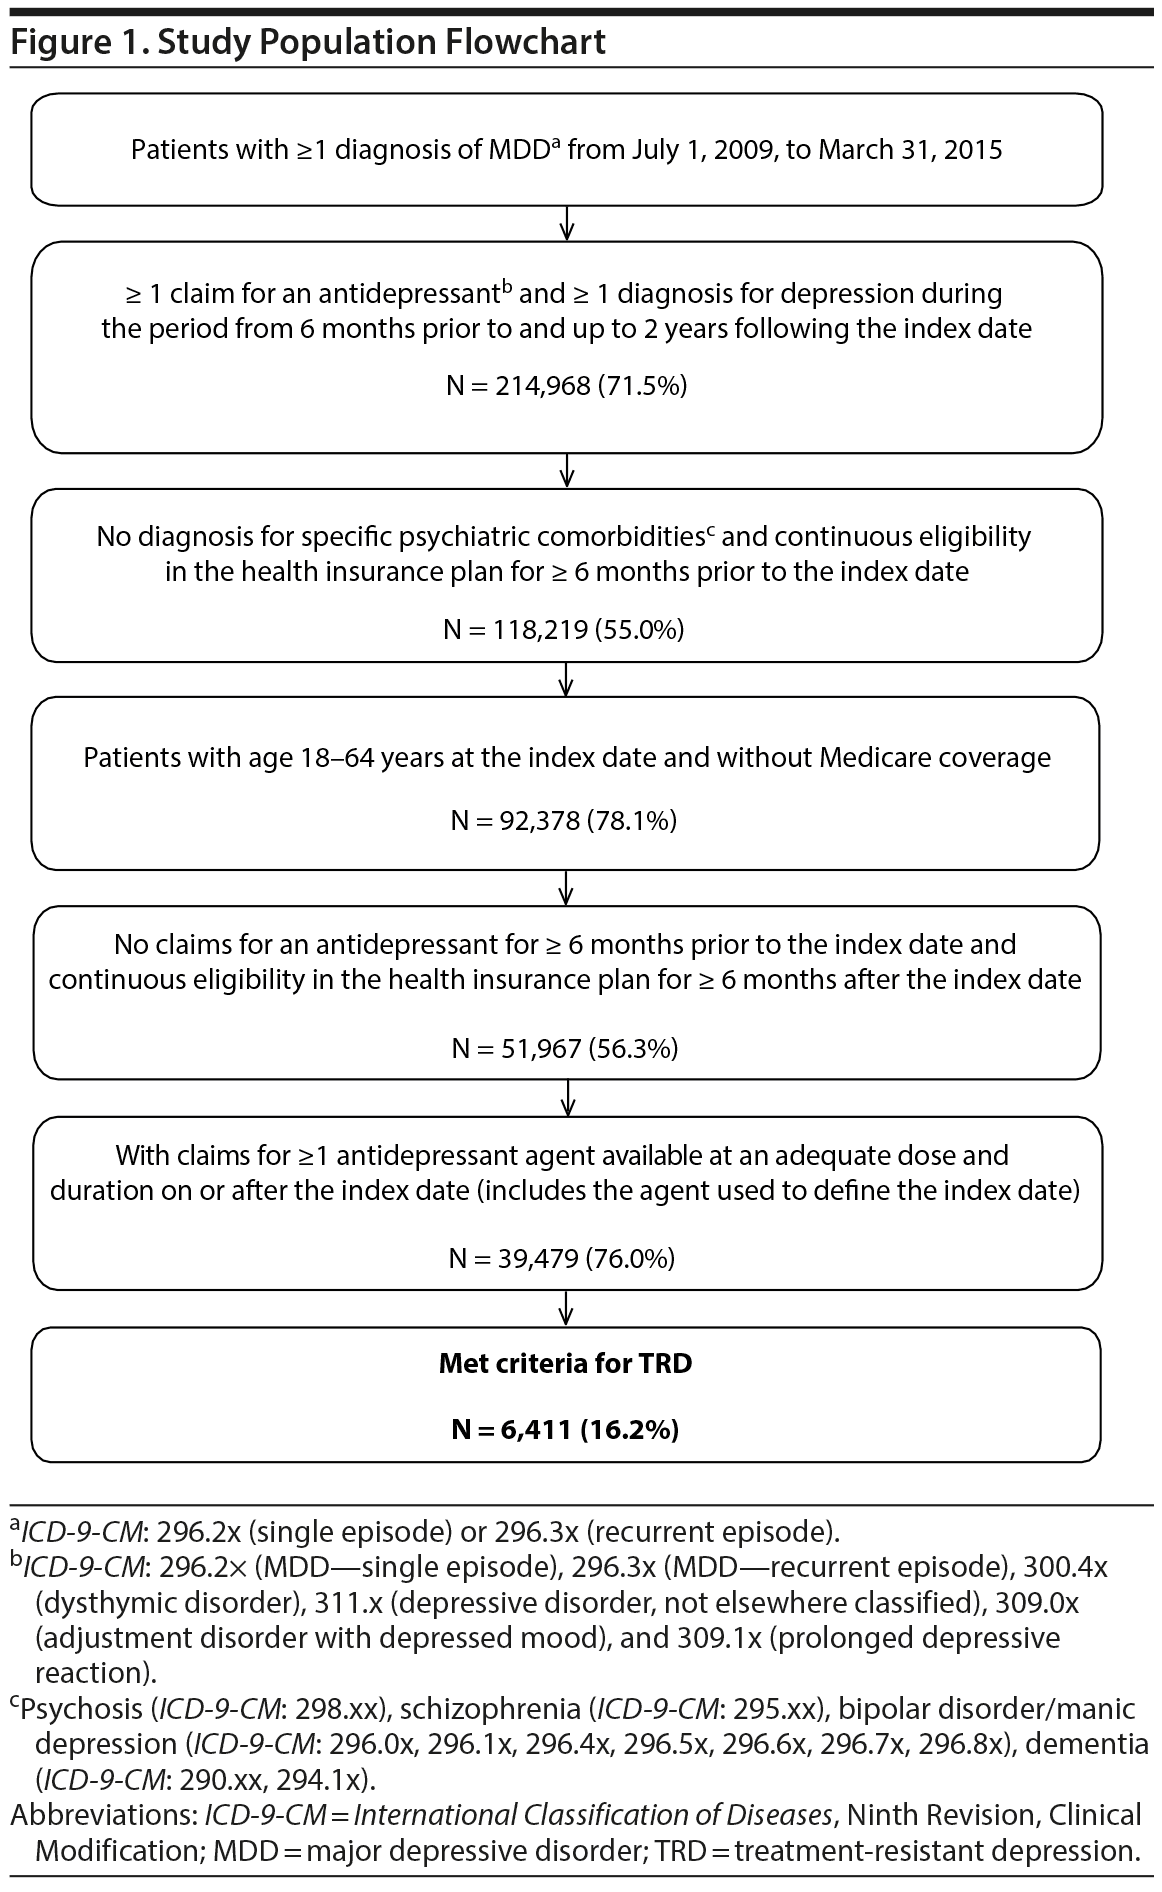
Among 39,479 treated MDD patients, 6,411 (16%) patients met the criteria for TRD, with a median time to TRD of 9 months (Figure 1), while the remaining 33,068 (84%) comprised the non-TRD MDD cohort (pre-matching). Of 500,000 randomly selected non-MDD patients, 149,884 (30%) met all inclusion/exclusion criteria and were used for matching.
Baseline Characteristics
TRD patients were mostly female (64%), with a mean age of 40.5 years (Table 1). Among the 6,411 TRD patients, 44% were primary plan holders (n = 2,800), 68% of whom (n = 1,908) had available work loss data. Prior to matching, TRD and non-TRD MDD patients were not significantly different in age, gender, or health care plan type. However, a higher proportion of TRD patients lived in the southern United States (33% vs 29%), and a lower proportion were primary plan holders (44% vs 47%; all P < .001) compared to non-TRD MDD patients. Compared to the unmatched non-MDD cohort, TRD patients were younger (41 vs 42 years), with a lower proportion being female (64% vs 50%) and primary plan holders (44% vs 51%; all P < .001).
After matching, both control cohorts were similar to the TRD cohort in demographics. TRD patients had a higher physical comorbidity burden than either matched control cohort (eg, TRD vs non-TRD MDD Quan-CCI: 0.3 vs 0.2), with higher proportions for hypertension (13%), hypothyroidism (6%), and chronic pulmonary disease (6%) compared to both control cohorts. TRD patients were more likely to use mental health-related medications compared to either matched control cohort (eg, TRD vs non-TRD MDD: 38% vs 26%) and received more unique mental health-related agents (eg, TRD vs non-TRD MDD, 0.6 vs 0.3). TRD patients also had higher PPPM baseline health care costs ($1,101) compared to non-TRD MDD ($828) or non-MDD matched controls ($380; all P < .001).
Treatment Patterns
During the observation period, 41% of TRD patients had ≥ 6 lines of antidepressant/augmentation therapy. All TRD and non-TRD MDD patients used an antidepressant during follow-up (per inclusion criteria), compared to 13% of non-MDD patients (Supplementary eTables 3). TRD patients used nearly twice as many unique antidepressant agents as non-TRD MDD patients (3.3 vs 1.7). The most commonly used antidepressant therapeutic classes were selective serotonin reuptake inhibitors (eg, TRD: 87%), norepinephrine-dopamine reuptake inhibitors (eg, TRD: 53%), and serotonin-norepinephrine reuptake inhibitors (eg, TRD: 49%). Most TRD patients received other psychiatric medications (91%), such as anxiolytics (69%), anticonvulsants (37%), and antipsychotics (31%); 42% were treated with psychotherapy. Fewer non-TRD MDD patients (58%) and non-MDD patients (15%) used other psychiatric medications compared to TRD patients (all P < .001).
Direct HRU and Costs
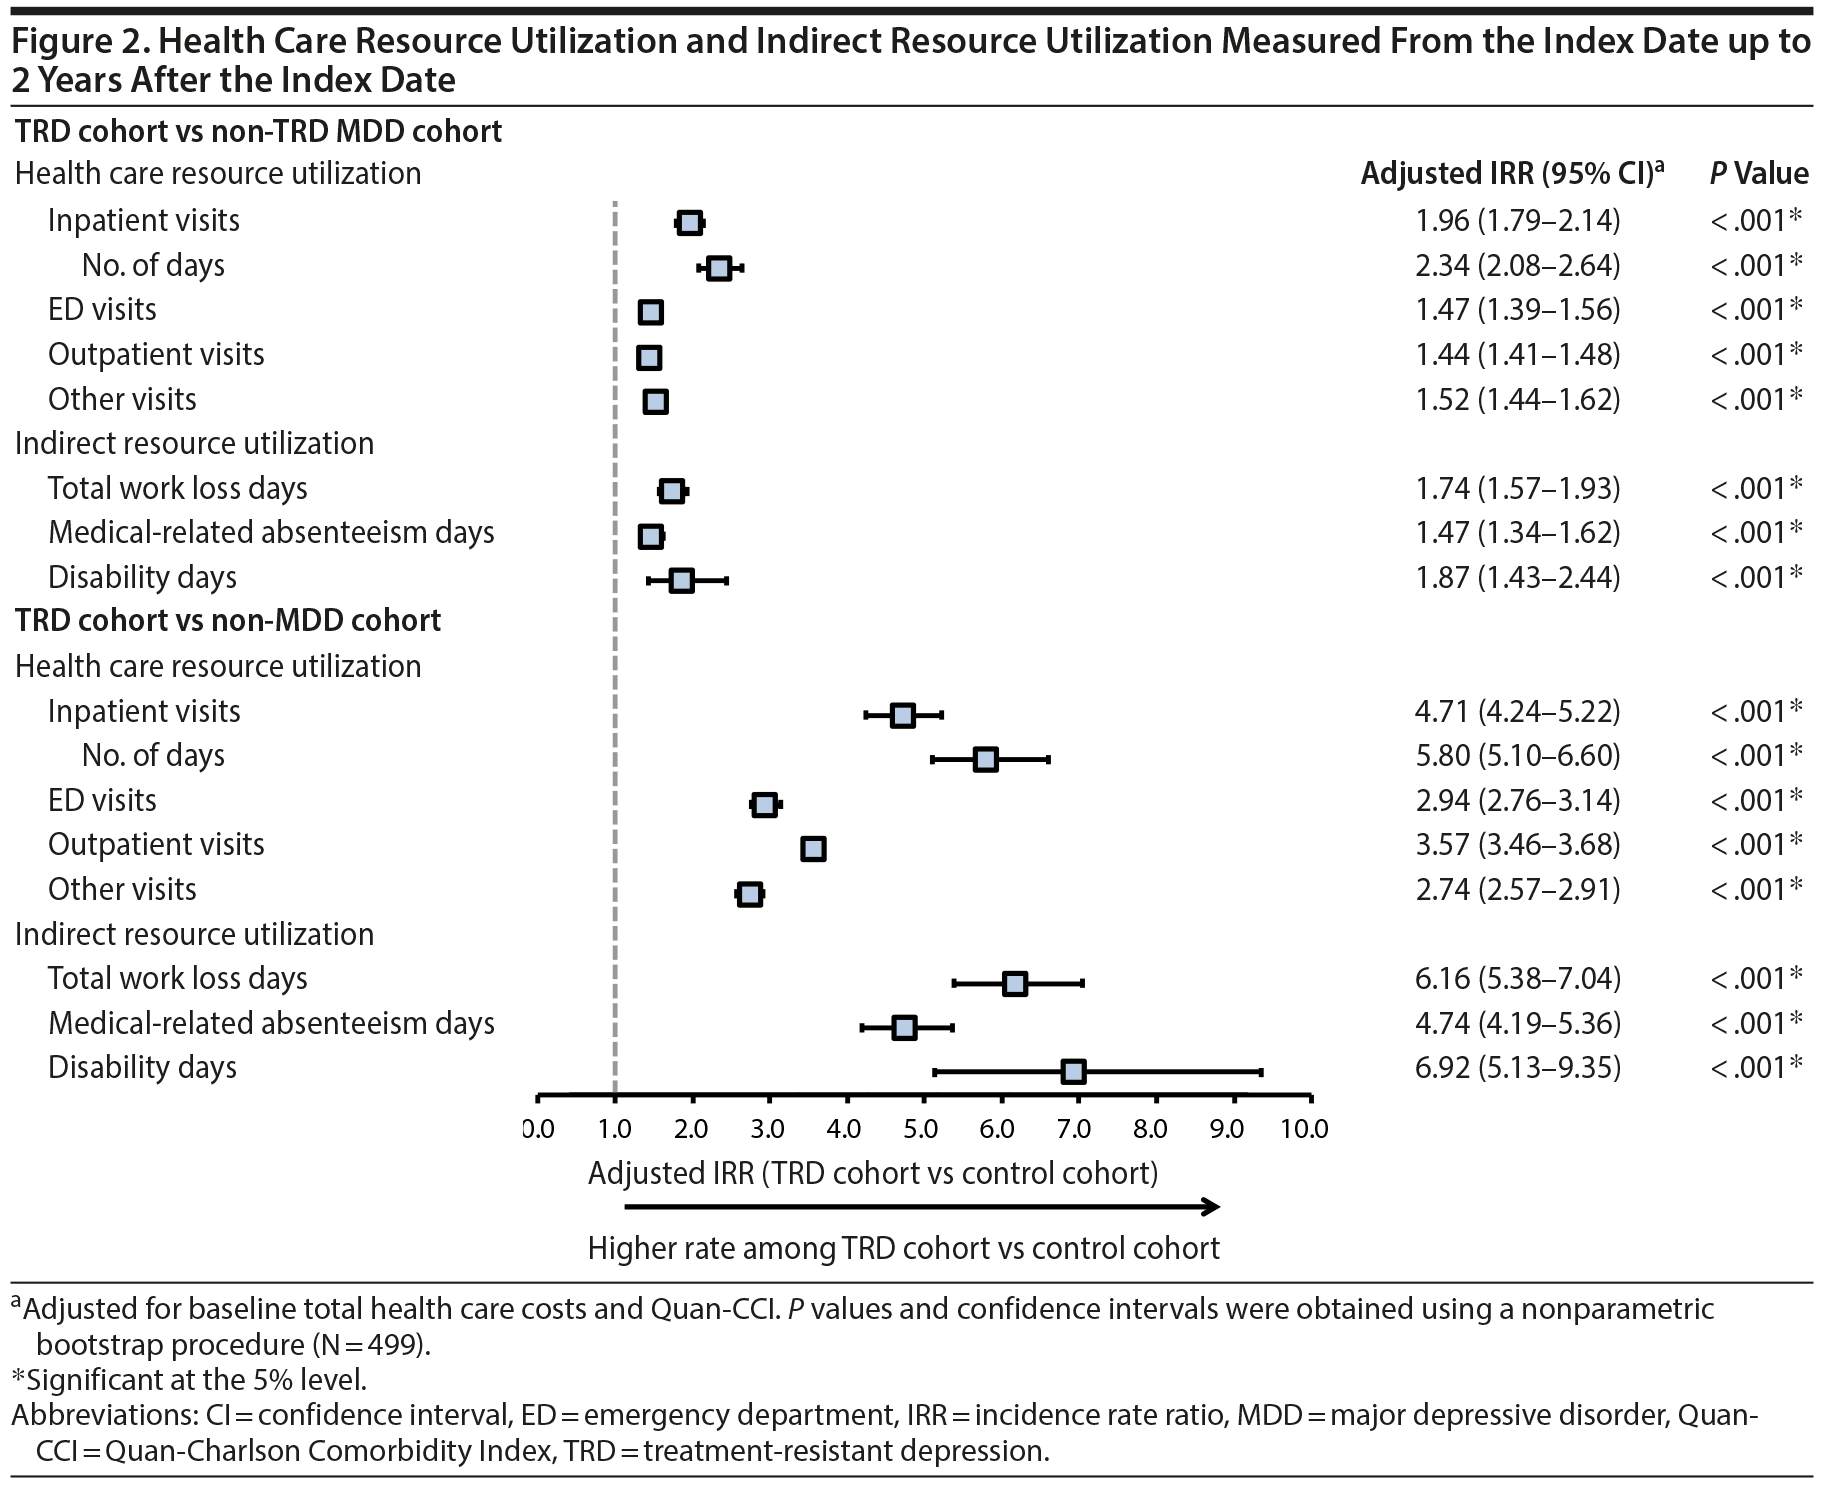
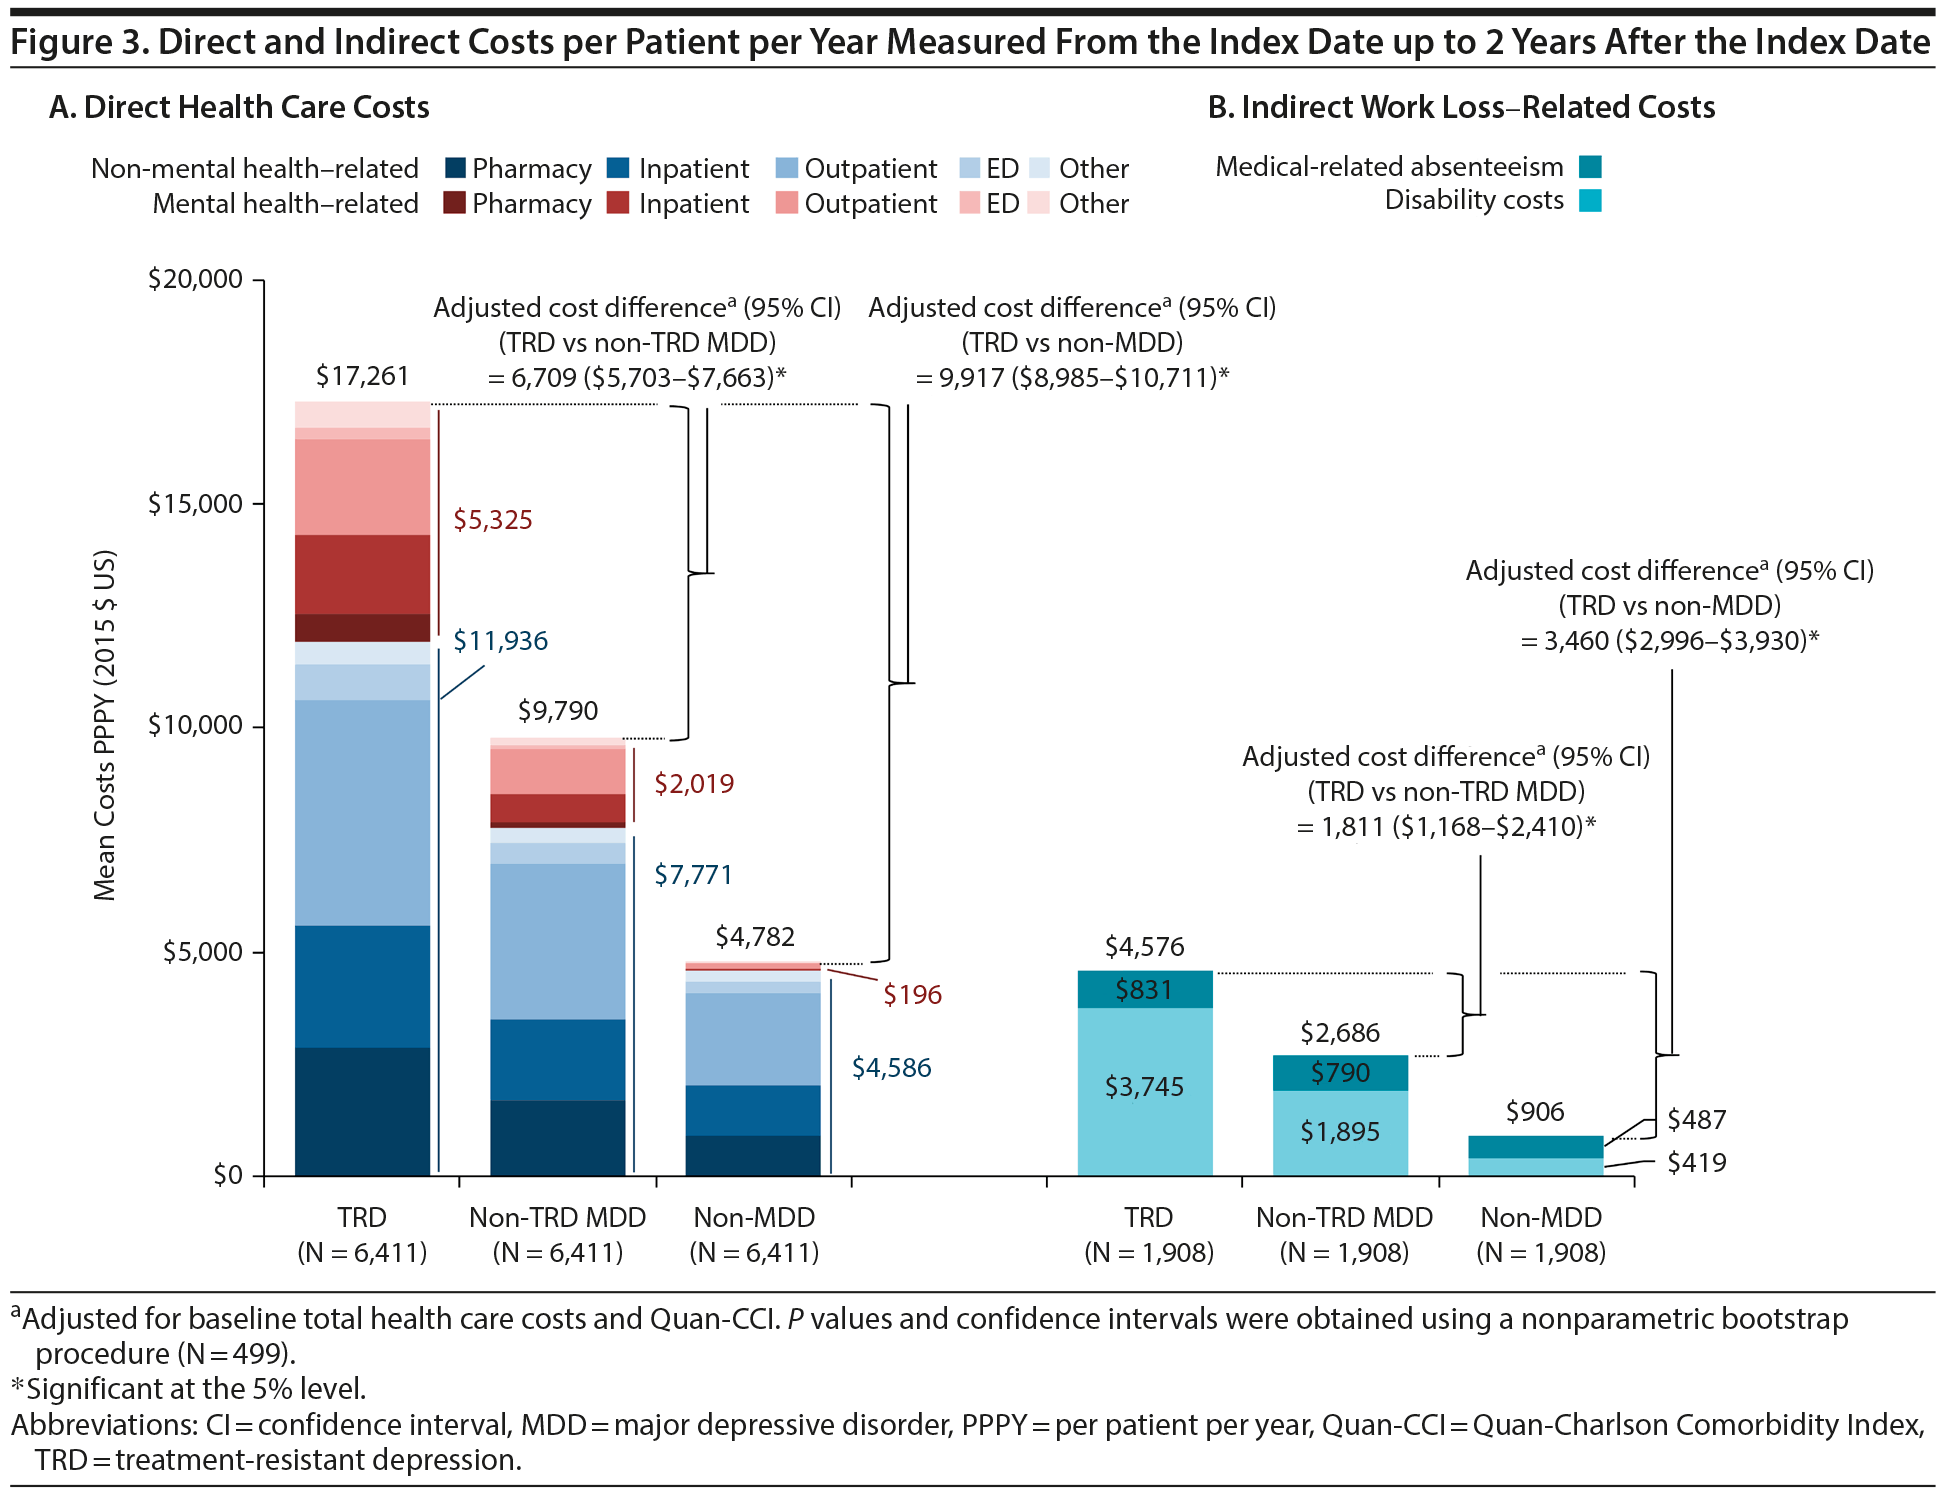
Results comparing HRU and direct costs between TRD and non-TRD MDD and non-MDD patients are shown in Figures 2 and 3A, respectively. TRD patients had more HRU than either control cohort (eg, 2.0 and 4.7 times the inpatient visit rate vs non-TRD MDD and non-MDD controls, respectively). Furthermore, TRD patients had higher PPPY direct health care costs: $6,709 more than non-TRD MDD controls and $9,917 more than non-MDD controls after adjustment (all P < .001). Higher direct costs among TRD patients were driven predominantly by higher inpatient and outpatient costs (details are shown in Supplementary eTables 4 and 5, respectively).
In a sensitivity analysis, unadjusted cost differences were also compared: larger differences were consistently found with a similar magnitude. Unadjusted PPPY health care costs in TRD patients were $7,471 higher than in non-TRD MDD controls and $12,479 higher than in non-MDD controls. Similar findings were also observed when the analysis was restricted to primary plan holders (data not shown).
Among TRD patients (ie, patients with failure of at least 2 antidepressant treatment courses), all-cause pharmacy and medical costs increased with the number of lines of therapy of adequate dose and duration (Figure 4). Specifically, as lines of therapy of adequate dose and duration increased from 2 to 6 or more, all-cause health care costs increased from $12,047 to $18,667 in TRD patients. Mental health-related and depression-related costs also increased with the number of lines of therapy of adequate dose and duration (Supplementary eTable 6).
Indirect HRU and Costs
Results for indirect work loss-related HRU and costs are shown in Figures 2 and 3B, respectively, and were measured up to 2 years post-index. TRD employees had 35.8 work loss days PPPY on average (25.8 disability and 10.0 medical-related absenteeism days; Supplementary eTables 7 and 8), which after adjustment was 1.7 and 6.2 times the rate of work loss days in employees with and without MDD, respectively. Consequently, TRD employees had higher PPPY work loss-related costs: $1,811 more than non-TRD MDD employees and $3,460 more than non-MDD employees (all P < .001).
Employment Status Change and Pre- and Post-COBRA Costs
Among employees (ie, primary plan holders), there were 212 TRD patients, 161 non-TRD MDD controls, and 141 non-MDD controls for whom there was employment status change during follow-up. TRD employees were 1.6 times more likely than non-TRD MDD employees (HR [95% CI]: 1.59 [1.06-2.39]; P = .023) and 2.3 times more likely than non-MDD employees (HR [95%, CI]: 2.29 [1.44-3.65]; P < .001) to switch to COBRA status during follow-up. There was no significant difference between cohorts for employment termination. The composite endpoint of termination or switch to COBRA was more likely among TRD than non-TRD MDD employees (HR [95% CI]: 1.28 [1.04-1.57]; P = .019) and non-MDD employees (HR [95% CI]: 1.37 [1.11-1.69]; P = .004).
The average pre-COBRA follow-up time was 10 months for TRD and 8 months for non-TRD MDD employees, while the average post-COBRA follow-up time was 9 months for both cohorts. Pre-COBRA average direct PPPM health care costs were similar for TRD (mean ± SD [median]: $2,620 ± $3,880 [$1,353]) and non-TRD MDD ($2,796 ± $5,558 [$579]) employees, while post-COBRA PPPM health care costs for TRD ($5,094 ± $14,163 [$1,051]) were twice those of non-TRD MDD employees ($2,346 ± $5,301 [$264]).
DISCUSSION
The present study found a substantial economic burden of TRD relative to that incurred by non-TRD MDD patients and non-MDD patients, consistent with what has been shown in literature.5,8,16,17,23-28,30 Specifically, direct and indirect HRU and costs were double those of non-TRD MDD patients and quadruple those of non-MDD patients, consistent with prior work (2 times the direct and indirect costs of non-TRD MDD patients17,24,26-28; 4 to 5 times higher than non-MDD patients17,24,26), although there are some methodological differences across the literature (eg, criteria used to define TRD). For example, Ivanova et al27 found that direct and indirect costs nearly doubled among patients with TRD versus MDD alone. Cost estimates in the present study did tend to be larger in magnitude compared to previous work (eg, Ivanova et al27 reported $11,392 in average annual direct costs [2007 US $] for TRD-likely employees). The direct cost burden in the present study was high irrespective of whether it was evaluated among primary plan holders only or included their dependents. The burden also increased with increasing levels of treatment resistance, which is consistent with prior work using staging methods or number of regimen changes to define TRD.25,30 Further, the rate of TRD among MDD patients reported in this study (16%) is similar to that reported in other claims-based studies (12%-15%),24,27 although higher rates have been observed in studies using prospective data collection or staging methods for TRD (~28%-39%).20,25,28,31
Although TRD did not significantly impact employment termination alone, TRD was significantly associated with status changes that prompted an employee to purchase COBRA coverage (eg, transition to part-time employment or medical leave). While precise reasons for changes to COBRA status are unknown, TRD employees may be more prone to seek COBRA coverage to ensure continuation of care for their medical needs, despite potentially costly implications.
Switching to COBRA coverage may also suggest that the employee is seeking new full-time employment, though this is unlikely, given that job turnover among patients with depression has been shown to relate to lower hourly earnings, a 4 times higher rate of presenteeism (ie, work loss productivity), and loss of employment due to impaired job performance.35 Presenteeism in TRD has been previously estimated at 6.1 times of absenteeism costs, translating in the present study to $9,645 PPPY in total work loss-related costs (up from $4,576 PPPY without presenteeism) for TRD employees.3,35
As other comorbidities can also contribute to TRD burden,3 a sensitivity analysis without adjustment for Quan-CCI and baseline health care costs revealed a similar magnitude of burden albeit with larger differences. This suggests that TRD itself contributes substantially to the burden in this population, beyond the contribution of MDD or comorbidities alone, and is most likely estimated conservatively in our primary analysis.3 The differences in comorbidities contributing to the overall burden may indicate that successfully controlling TRD could potentially result in additional cost savings from non-mental health-related conditions associated with depression3,27 and improvements in employment outcomes (eg, employment rate increase with better depression symptom control).35
The strength of the study comes from directly comparing TRD patients to patients with and without MDD, as well as assessing employees and employment status changes to illustrate an incremental TRD burden on a continuum (ie, from depression-free to likely most-severe forms of TRD with multiple lines of therapy). Employment changes and absenteeism assessments further illustrate the TRD burden in a working population most affected by the disorder.17,31,32 Few studies to date have included these 2 comparison groups while assessing direct and indirect HRU and costs as well as employment status change in the same patients.
Limitations
TRD exists along a clinical continuum without a consensus definition, though the present study used the most common TRD definition. Diagnoses reported in claims (including disability claims) are for administrative purposes and were not validated; thus, they may be underreported as a function of social stigma. TRD was defined using pharmacy claims and excludes other clinical considerations (eg, persistence of symptoms). In addition, employment data lacked the full range of presenteeism outcomes. Health care and disability claims may also be subject to inaccuracies, although these are likely to affect all cohorts similarly. Finally, the results may not be generalizable to the population at large given specific study criteria among a privately insured US population.
CONCLUSIONS
The present study demonstrated that TRD carries a significant direct and indirect economic burden and adversely affects employment, with direct costs increasing substantially with levels of resistance. These results add to the cost-of-illness literature by demonstrating an unmet need and the importance of developing novel treatments beyond those currently available for patients suffering with MDD. If such therapies could help to address the crippling effects of TRD on patients’ personal and professional lives, while reducing the economic burden on health care payers, they would provide tremendous societal benefits. Further research is needed to increase our understanding of factors responsible for TRD and to improve quality of care for patients suffering from this disorder.
Submitted: June 1, 2017; accepted September 12, 2017.
Published online: February 20, 2018.
Author contributions: All authors contributed to the conception and design of the study and to the interpretation of findings. Mr Pilon, Ms Kamstra, and Dr Pivneva performed the analysis.
Potential conflicts of interest: Dr Amos and Ms Tandon are employees of Janssen Scientific Affairs, LLC, and Johnson & Johnson stockholders. Messrs Lefebvre, Pilon, and Greenberg; Ms Kamstra; and Dr Pivneva are employees of Analysis Group, Inc, a consulting company that has received research grants from Janssen Scientific Affairs, LLC, to conduct this study.
Funding/support: Supported by Janssen Scientific Affairs, LLC.
Role of the sponsor: Janssen Scientific Affairs, LLC, participated in the study design, study conduct, interpretation of data, and review and approved the manuscript for publication.
Previous presentation: Part of the material in this article was presented at the Academy of Managed Care Pharmacy Annual Meeting, March 27-30, 2017, Denver, Colorado, and at the American Psychiatric Association Annual Meeting, May 20-24, 2017, San Diego, California.
Additional information: The data used for the present study were licensed by Analysis Group, Inc. from OptumHealth Care Solutions, Inc. and are not publically available.
Supplementary material: Available at PSYCHIATRIST.COM.
REFERENCES
1. Cusin C, Ionescu DF, Pavone KJ, et al. Ketamine augmentation for outpatients with treatment-resistant depression: preliminary evidence for two-step intravenous dose escalation. Aust N Z J Psychiatry. 2017;51(1):55-64. PubMed CrossRef
2. Kessler RC, Chiu WT, Demler O, et al. Prevalence, severity, and comorbidity of 12-month DSM-IV disorders in the National Comorbidity Survey Replication. Arch Gen Psychiatry. 2005;62(6):617-627. PubMed CrossRef
3. Greenberg PE, Fournier AA, Sisitsky T, et al. The economic burden of adults with major depressive disorder in the United States (2005 and 2010). J Clin Psychiatry. 2015;76(2):155-162. PubMed CrossRef
4. Berto P, D’ Ilario D, Ruffo P, et al. Depression: cost-of-illness studies in the international literature, a review. J Ment Health Policy Econ. 2000;3(1):3-10. PubMed CrossRef
5. Birnbaum HG, Ben-Hamadi R, Greenberg PE, et al. Determinants of direct cost differences among US employees with major depressive disorders using antidepressants. Pharmacoeconomics. 2009;27(6):507-517. PubMed CrossRef
6. Greenberg PE, Birnbaum HG. The economic burden of depression in the US: societal and patient perspectives. Expert Opin Pharmacother. 2005;6(3):369-376. PubMed CrossRef
7. Luppa M, Heinrich S, Angermeyer MC, et al. Cost-of-illness studies of depression: a systematic review. J Affect Disord. 2007;98(1-2):29-43. PubMed CrossRef
8. Birnbaum HG, Kessler RC, Kelley D, et al. Employer burden of mild, moderate, and severe major depressive disorder: mental health services utilization and costs, and work performance. Depress Anxiety. 2010;27(1):78-89. PubMed CrossRef
9. Doshi JA, Cen L, Polsky D. Depression and retirement in late middle-aged US workers. Health Serv Res. 2008;43(2):693-713. PubMed CrossRef
10. Greenberg PE, Birnbaum SA. Cost of depression: current assessment and future directions. Expert Rev Pharmacoecon Outcomes Res. 2001;1(1):69-76. PubMed CrossRef
11. Kessler RC, Berglund P, Demler O, et al. The epidemiology of major depressive disorder: results from the National Comorbidity Survey Replication (NCS-R). JAMA. 2003;289(23):3095-3105. PubMed CrossRef
12. Marcotte DE, Wilcox-Gok V, Redmon PD. Prevalence and patterns of major depressive disorder in the United States labor force. J Ment Health Policy Econ. 1999;2(3):123-131. PubMed CrossRef
13. Ferrari AJ, Charlson FJ, Norman RE, et al. The epidemiological modelling of major depressive disorder: application for the Global Burden of Disease Study 2010. PLoS One. 2013;8(7):e69637. PubMed CrossRef
14. Stewart WF, Ricci JA, Chee E, et al. Cost of lost productive work time among US workers with depression. JAMA. 2003;289(23):3135-3144. PubMed CrossRef
15. Kessler RC, Bromet EJ. The epidemiology of depression across cultures. Annu Rev Public Health. 2013;34(1):119-138. PubMed CrossRef
16. Dewa CS, Hoch JS, Lin E, et al. Pattern of antidepressant use and duration of depression-related absence from work. Br J Psychiatry. 2003;183(6):507-513. PubMed CrossRef
17. Mrazek DA, Hornberger JC, Altar CA, et al. A review of the clinical, economic, and societal burden of treatment-resistant depression: 1996-2013. Psychiatr Serv. 2014;65(8):977-987. PubMed CrossRef
18. Parikh RM, Lebowitz BD. Current perspectives in the management of treatment-resistant depression. Dialogues Clin Neurosci. 2004;6(1):53-60. PubMed
19. Rush AJ. Treatment-resistant mood disorders. Am J Psychiatry. 2003;160(1):201-a-202. CrossRef
20. Rush AJ, Trivedi MH, Wisniewski SR, et al. Acute and longer-term outcomes in depressed outpatients requiring one or several treatment steps: a STAR*D report. Am J Psychiatry. 2006;163(11):1905-1917. PubMed CrossRef
21. Nemeroff CB. Prevalence and management of treatment-resistant depression. J Clin Psychiatry. 2007;68(suppl 8):17-25. PubMed
22. Greden JF. The burden of disease for treatment-resistant depression. J Clin Psychiatry. 2001;62(suppl 16):26-31. PubMed
23. Crown WH, Finkelstein S, Berndt ER, et al. The impact of treatment-resistant depression on health care utilization and costs. J Clin Psychiatry. 2002;63(11):963-971. PubMed CrossRef
24. Corey-Lisle PK, Birnbaum HG, Greenberg PE, et al. Identification of a claims data “signature” and economic consequences for treatment-resistant depression. J Clin Psychiatry. 2002;63(8):717-726. PubMed CrossRef
25. Gibson TB, Jing Y, Smith Carls G, et al. Cost burden of treatment resistance in patients with depression. Am J Manag Care. 2010;16(5):370-377. PubMed
26. Greenberg P, Corey-Lisle PK, Birnbaum H, et al. Economic implications of treatment-resistant depression among employees. Pharmacoeconomics. 2004;22(6):363-373. PubMed CrossRef
27. Ivanova JI, Birnbaum HG, Kidolezi Y, et al. Direct and indirect costs of employees with treatment-resistant and non-treatment-resistant major depressive disorder. Curr Med Res Opin. 2010;26(10):2475-2484. PubMed CrossRef
28. Olchanski N, McInnis Myers M, Halseth M, et al. The economic burden of treatment-resistant depression. Clin Ther. 2013;35(4):512-522. PubMed CrossRef
29. Fostick L, Silberman A, Beckman M, et al. The economic impact of depression: resistance or severity? Eur Neuropsychopharmacol. 2010;20(10):671-675. PubMed CrossRef
30. Russell JM, Hawkins K, Ozminkowski RJ, et al. The cost consequences of treatment-resistant depression. J Clin Psychiatry. 2004;65(3):341-347. PubMed CrossRef
31. Amital D, Fostick L, Silberman A, et al. Serious life events among resistant and non-resistant MDD patients. J Affect Disord. 2008;110(3):260-264. PubMed CrossRef
32. Fronstin P. Individuals with COBRA coverage, 1994-1995. Consolidated Omnibus Budget Reconciliation Act. Stat Bull Metrop Insur Co. 1998;79(2):17-23. PubMed
33. American Psychiatric Association. Practice Guidelines for Treatment of Patients with Major Depressive Disorder. 3rd ed. https://psychiatryonline.org/pb/assets/raw/sitewide/practice_guidelines/guidelines/mdd.pdf. 2010.
34. Quan H, Sundararajan V, Halfon P, et al. Coding algorithms for defining comorbidities in ICD-9-CM and ICD-10 administrative data. Med Care. 2005;43(11):1130-1139. PubMed doi:10.1097/01.mlr.0000182534.19832.83
35. Lerner D, Adler DA, Chang H, et al. Unemployment, job retention, and productivity loss among employees with depression. Psychiatr Serv. 2004;55(12):1371-1378. PubMed CrossRef
This PDF is free for all visitors!
Save
Cite
