Background: Difficulties in predicting suicidal behavior hamper effective suicide prevention. Therefore, there is a great need for reliable biomarkers, and neuroimaging may help to identify such markers.
Methods: Electroencephalography (EEG) was used to investigate resting state spatial-frequency power characteristics of female patients with major depressive disorder (MDD); 19 were recent suicide attempters (within the previous 30 days), 36 were suicide ideators, and 23 were nonsuicidal. Patients were enrolled at neuroCare Clinic Nijmegen (Nijmegen, the Netherlands) between May 2007 and November 2016, and the primary diagnosis of nonpsychotic MDD was confirmed using the Mini-International Neuropsychiatric Interview, DSM-IV criteria, and a score of ≥ 14 on the 21-item Beck Depression Inventory. Nonparametric, cluster-based permutation tests were applied to detect robust power differences between the study groups on the EEG broadband signal (2-100 Hz). Furthermore, a nonadaptive distributed source imaging method (eLORETA) was utilized to examine if these suicide-based frequency characteristics are localized in brain areas previously reported in the neuroimaging literature.
Results: When compared to nonsuicidal depressed patients, attempters and ideators displayed both decreased beta and low gamma activity in the frontal regions. Moreover, ideators had increased alpha activity over the posterior regions and increased high beta, low gamma activity over the left occipital region when compared to psychiatric controls. Attempters had reduced beta and low gamma activity over the right temporal region when compared to ideators. In addition, eLORETA localized attempter and ideator reduced frontal activity within the orbito-, medial-, middle-, superior-, and inferior-frontal areas and the anterior cingulate cortex. In attempters, reduced right temporal activity was localized within the right inferior-, middle-, and superior-temporal cortices and the fusiform gyrus.
Conclusions: Frequency power characteristics of attempters and ideators are consistent with findings from the neuroimaging literature concerning suicide, implying EEG resting state assessment could become a potential biomarker to predict suicide risk.

Electroencephalogram Resting State Frequency Power Characteristics of Suicidal Behavior in Female Patients With Major Depressive Disorder

ABSTRACT
Background: Difficulties in predicting suicidal behavior hamper effective suicide prevention. Therefore, there is a great need for reliable biomarkers, and neuroimaging may help to identify such markers.
Methods: Electroencephalography (EEG) was used to investigate resting state spatial-frequency power characteristics of female patients with major depressive disorder (MDD); 19 were recent suicide attempters (within the previous 30 days), 36 were suicide ideators, and 23 were nonsuicidal. Patients were enrolled at neuroCare Clinic Nijmegen (Nijmegen, the Netherlands) between May 2007 and November 2016, and the primary diagnosis of nonpsychotic MDD was confirmed using the Mini-International Neuropsychiatric Interview, DSM-IV criteria, and a score of ≥ 14 on the 21-item Beck Depression Inventory. Nonparametric, cluster-based permutation tests were applied to detect robust power differences between the study groups on the EEG broadband signal (2-100 Hz). Furthermore, a nonadaptive distributed source imaging method (eLORETA) was utilized to examine if these suicide-based frequency characteristics are localized in brain areas previously reported in the neuroimaging literature.
Results: When compared to nonsuicidal depressed patients, attempters and ideators displayed both decreased beta and low gamma activity in the frontal regions. Moreover, ideators had increased alpha activity over the posterior regions and increased high beta, low gamma activity over the left occipital region when compared to psychiatric controls. Attempters had reduced beta and low gamma activity over the right temporal region when compared to ideators. In addition, eLORETA localized attempter and ideator reduced frontal activity within the orbito-, medial-, middle-, superior-, and inferior-frontal areas and the anterior cingulate cortex. In attempters, reduced right temporal activity was localized within the right inferior-, middle-, and superior-temporal cortices and the fusiform gyrus.
Conclusions: Frequency power characteristics of attempters and ideators are consistent with findings from the neuroimaging literature concerning suicide, implying EEG resting state assessment could become a potential biomarker to predict suicide risk.
J Clin Psychiatry 2019;80(6):18m12661
To cite: Benschop L, Baeken C, Vanderhasselt M-A, et al. Electroencephalogram resting state frequency power characteristics of suicidal behavior in female patients with major depressive disorder. J Clin Psychiatry. 2019;80(6):18m12661.
To share: https://doi.org/10.4088/JCP.18m12661
© Copyright 2019 Physicians Postgraduate Press, Inc.
aDepartment of Psychiatry and Medical Psychology, Ghent University, Ghent, Belgium
bDepartment of Psychiatry, UZ Brussels, Free University of Brussels, Brussels, Belgium
cEindhoven University of Technology, Department of Electrical Engineering, Eindhoven, the Netherlands
dDepartment of Experimental Clinical and Health Psychology, Ghent University, Ghent, Belgium
eDepartment of Data Analysis, Ghent University, Ghent, Belgium
fResearch Institute Brainclinics, Nijmegen, the Netherlands
gDepartment of Experimental Psychology, Utrecht University, Utrecht, the Netherlands
hNeuroCare Group Netherlands, Nijmegen, the Netherlands
*Corresponding author: Lars Benschop, MSc, Department of Psychiatry and Medical Psychology, University of Ghent, Corneel Heymanslaan 10, 9000 Ghent, Belgium ([email protected]).
Suicide accounts for approximately 840,000 deaths per year worldwide,1 while suicide attempts exceed those numbers by a factor of 10 to 20.2 Despite the high incidence and the severe consequences on the afflicted individuals and their surroundings, accurately assessing suicide risk is still a challenging endeavor. Although research has identified reliable long-term risk factors for suicidal behavior, the short-term predictive power of these risk factors proves to be inadequate.3 Moreover, due to feelings of shame and/or fear, individuals who are at risk of suicidal behavior often disguise their wish to die from clinicians or family members.4,5 Considering the unpredictable and grievous nature of suicidal behavior, along with the present limitations regarding suicide risk assessment, developing reliable biomarkers of acute suicidality may be of essence.
A reliable biomarker should provide an objective measurement that includes information about the underlying physiologic or pathologic processes.6 Such a measurement could then be used for diagnostics or treatment outcome. Recently, research has emerged trying to identify neural correlates of suicide risk to establish effective suicide prevention procedures.7,8 The bulk of these studies rely on functional magnetic resonance imaging (fMRI), single-photon emission computed tomography (SPE[C]T), or positron emission tomography (PET) imaging methods to search for structural and/or functional characteristics of individuals with a high vulnerability for suicidal behavior. For example, in a promising study using machine-learning algorithms on subjects’ distinct neural fMRI signatures when exposed to death- and life-related concepts, Just and colleagues9 demonstrated that suicidal ideation could be accurately predicted (91%). Furthermore, this classifier also could successfully differentiate between ideators (ie, major depressive disorder [MDD] patients with suicidal thoughts) who had and had not attempted suicide (94%).
Notwithstanding, (f)MRI, SPE(C)T, and PET scanners are not routinely employed in most psychiatric facilities since they are expensive, time consuming, frequently unavailable, or altogether lacking. In contrast, the electroencephalogram (EEG) is a relatively cost-effective, accessible, and time-efficient brain-imaging tool that has been applied for both diagnostics and treatment of neuropsychiatric disorders.10 Nevertheless, research investigating the potential of EEG for suicide risk assessment is surprisingly scarce and predominantly based on depression-related markers such as alpha asymmetry11,12 and frontal theta power.13-15 In a recent meta-analysis, the reliability of alpha asymmetry as a biomarker for psychiatric disorders was investigated but showed limited diagnostic value.16 Likewise, the few studies investigating frontal theta power as a potential candidate for suicide risk assessment reported contradictory results.15 Therefore, there is a need to identify electrophysiologic characteristics unique for suicidal behavior, unconstrained by depression-related findings.
To address these concerns, the current study contrasted broadband (2-100 Hz) resting state EEG in patients with MDD, including recent suicide attempters, suicide ideators, and MDD patients with a low suicide risk. Advanced EEG analyses increase the reliability of the results by means of stringent multiple comparisons controlled permutation testing,17 whereas (non-)adaptive distributed source imaging methods such as eLORETA18 can increase confidence in the validity of the findings through the convergence of spatially localized frequency power differences with the neuroimaging literature concerning suicide risk. In summary, the aim of this data-driven EEG study was to investigate whether MDD patients with either a recent suicide attempt or suicidal ideation have unique spatial-frequency power characteristics when compared to MDD patients without suicidal ideation or behavior. Data-driven approaches may reveal topographical EEG characteristics unique to suicide attempters and/or ideators and establish a benchmark for future electrophysiologic research concerning suicide.
METHODS
Participants
Patient recruitment and sample size, assessment of depression and suicide risk, and inclusion and exclusion criteria are outlined in Supplementary Appendix 1. In brief, the study sample consisted of 78 female patients with major depressive disorder (MDD): 19 were recent suicide attempters (within the previous 30 days), 36 were suicide ideators, and 23 were nonsuicidal. Patients were enrolled at neuroCare Clinic Nijmegen (Nijmegen, the Netherlands) between May 2007 and November 2016, and the primary diagnosis of nonpsychotic MDD was confirmed using the Mini-International Neuropsychiatric Interview (MINI), DSM-IV criteria, and a score of ≥ 14 on the 21-item Beck Depression Inventory (BDI). All participants signed an informed consent form and agreed upon the data being used for research purposes.

- Although substantial efforts have been made in the search for markers of suicidality, accurately assessing acute suicide risk is still a challenging endeavor.
- The electroencephalogram is an insufficiently researched but potentially powerful ally in suicide prevention efforts.
EEG Procedure and Preprocessing
The details of the EEG procedure and preprocessing steps are outlined in Supplementary Appendix 1.
Preliminary Analysis
A preliminary analysis was performed using R (version 3.5, R Foundation for Statistical Computing; Vienna, Austria; 2018) to investigate if the 3 groups (ie, MDD attempters, MDD ideators, and MDD controls) were significantly different with respect to age, BDI scores, and comorbid MINI diagnosis. Bartlett test of homogeneity of variances indicated that the variances were not significantly different for both the variables age and BDI scores. Thus, a standard multivariate analysis was applied to examine the effect of study group on age and BDI scores. A cross-table χ2 analysis was also performed to inspect if MINI diagnosis differed significantly between the study groups.
EEG Analysis
The primary EEG analysis was performed in MATLAB (Version R2016b, The MathWorks, Inc, Natick, Massachusetts) using functions from the EEGlab Toolbox19 and the Signal Processing Toolbox. Current source density (CSD) was applied to all of the data using the spherical spline approach described by Perrin and colleagues.20 CSD (ie, Surface Laplacian) is a spatial filter that attenuates signal noise resulting from volume conduction and deep-source contaminants. As a result, topographical distributions of electro-cortical dynamics are more accurately depicted facilitating localization.21 Frequency decomposition was achieved through complex Morlet wavelet convolution. The wavelets’ frequency spectrum was logarithmically distributed in 40 increments ranging from 2-100 Hz. The number of wavelet cycles was adjusted as a function of frequency (ie, 3 cycles for the lowest frequency and 10 cycles for the highest frequency). The fast-Fourier transform of the CSD-filtered data was convolved with the wavelets to extract each participant’s power spectra. Power extraction was applied only on eyes closed data since it controls for the confounding effects of visual scenes.22
Cluster-based permutation testing was applied for statistical evaluation considering the necessity to control for the familywise error rate. A detailed explanation of the method has been published elsewhere.17 A concise description of the cluster-based permutation method can be found in Supplementary Appendix 1.
Most EEG studies perform cluster-based thresholding on time-frequency maps. However, since the current study uses resting state data and since we were interested in localizing power differences on topographical maps, the data were collapsed over the time dimension. Therefore, the cluster-based thresholding was applied on the spatial (ie, electrode grid) frequency dimension. This was accomplished through extracting the 2D grid of interpolated electrode values from EEGlab’s topoplot.m function for every frequency bin. This resulted in a cylinder of data, comprising 40 (ie, the number of frequency bins) stacked slices, in which each slice represents a cluster-thresholded and frequency-specific topographical plot. For a concise overview and practical implementations of cluster-based thresholding and other EEG analyses, see Cohen.23
In addition, a post hoc analysis of covariance (ANCOVA) was performed in R (version 3.5) to investigate if the results of the cluster based permutation analysis were driven by BDI scores. This was achieved by extracting the peak significant pixel for every contrast from the cluster based analysis. The location of this peak significant pixel was then used as an index within the 3D data matrix (grid 1 ×— grid 2 ×— frequency) to extract a power value for each subject. The extracted power values were then used as the dependent variable within an ANCOVA with study group as the independent variable and BDI scores as a covariate. Additionally, Cohen’s d was calculated on the extracted power values to give an estimation of the effect size of the findings.
eLORETA Analysis
The details of the eLORETA analysis are outlined in Supplementary Appendix 1.
RESULTS
Effect of Study Group on Age, BDI Scores, and MINI Diagnosis
The multivariate test revealed no significant difference between the study groups with regard to age (F2,75 = 2.63, P = .11) (Table 1). A significant difference was found between the study groups in BDI scores (F2,75 = 9.80, P < .001). A subsequent Bonferroni-corrected post hoc test revealed that the attempter group (mean = 42.16, SD = 10.05) had significantly higher BDI scores than the ideator group (mean = 31.28, SD = 9.30, P < .001) and the low-risk group (mean = 28.61, SD = 9.00, P < .001). The ideator group and the low-risk group did not differ significantly for BDI scores (P = .8). The χ2 analysis revealed no significant differences between the study groups regarding MINI diagnosis (χ212 [N = 78] = 12.18, P = .432). These results can be found in Supplementary Appendix 1.
Spatial-Frequency Cluster Analysis
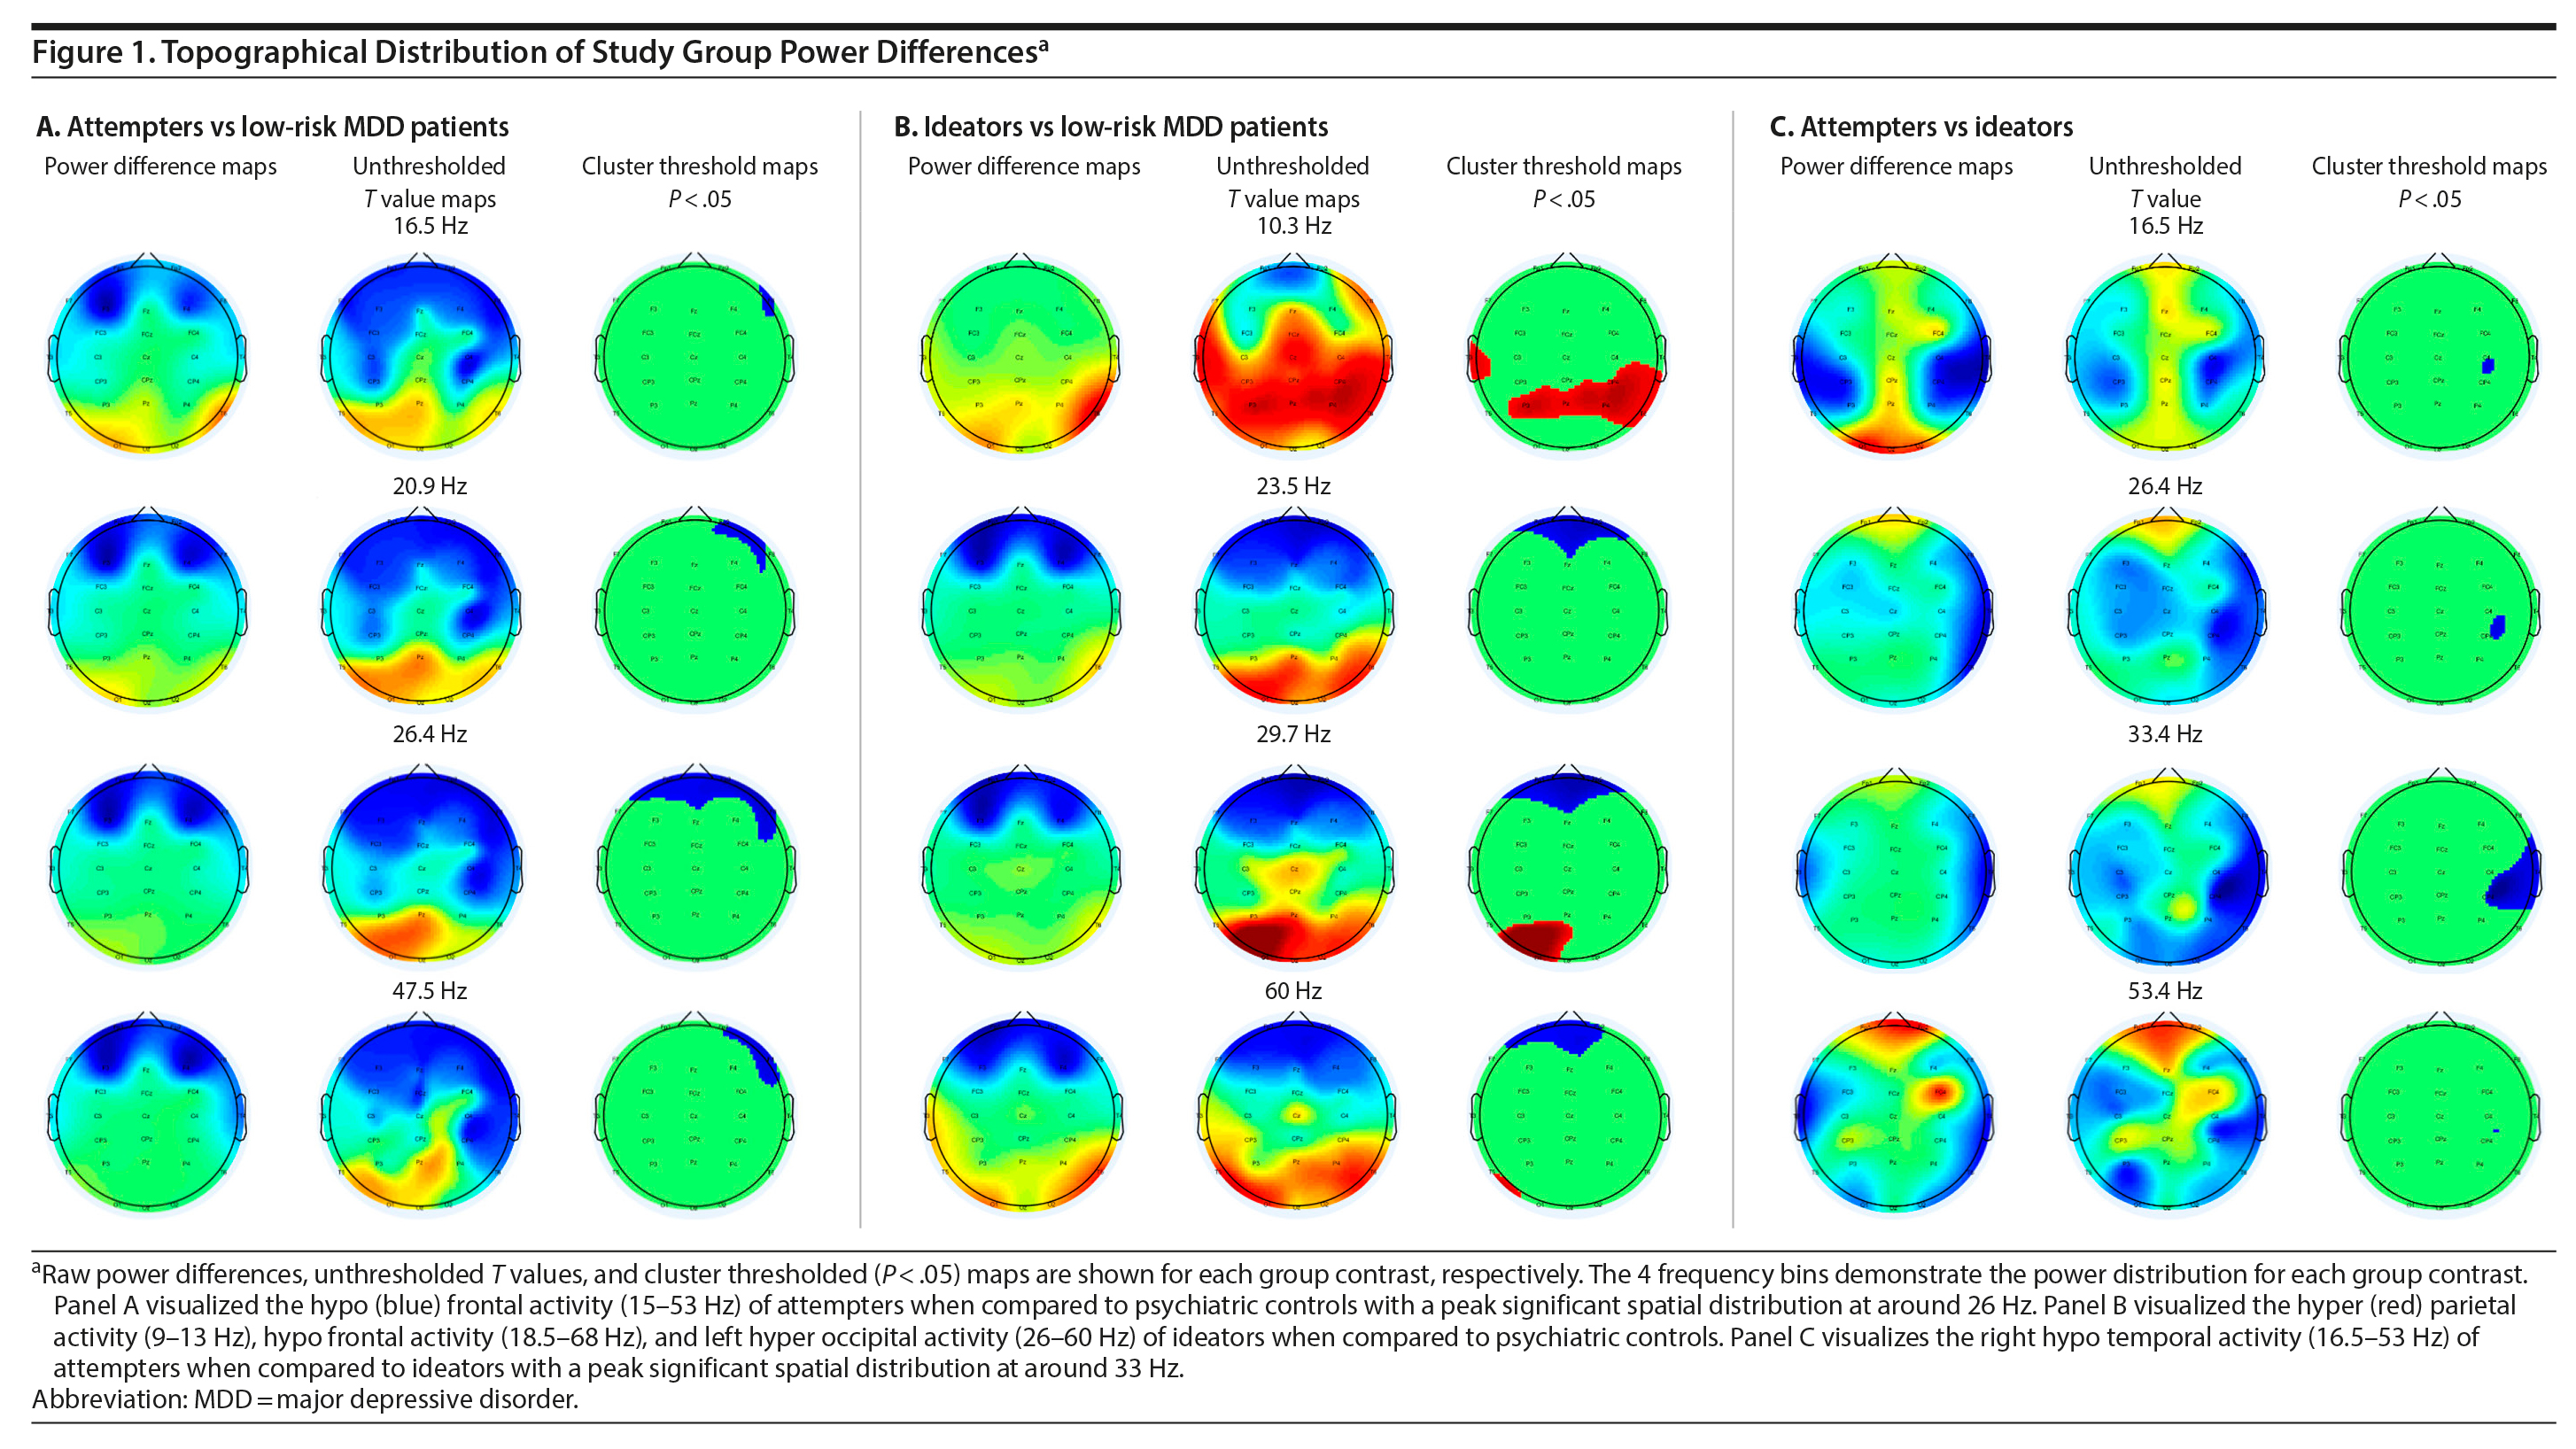
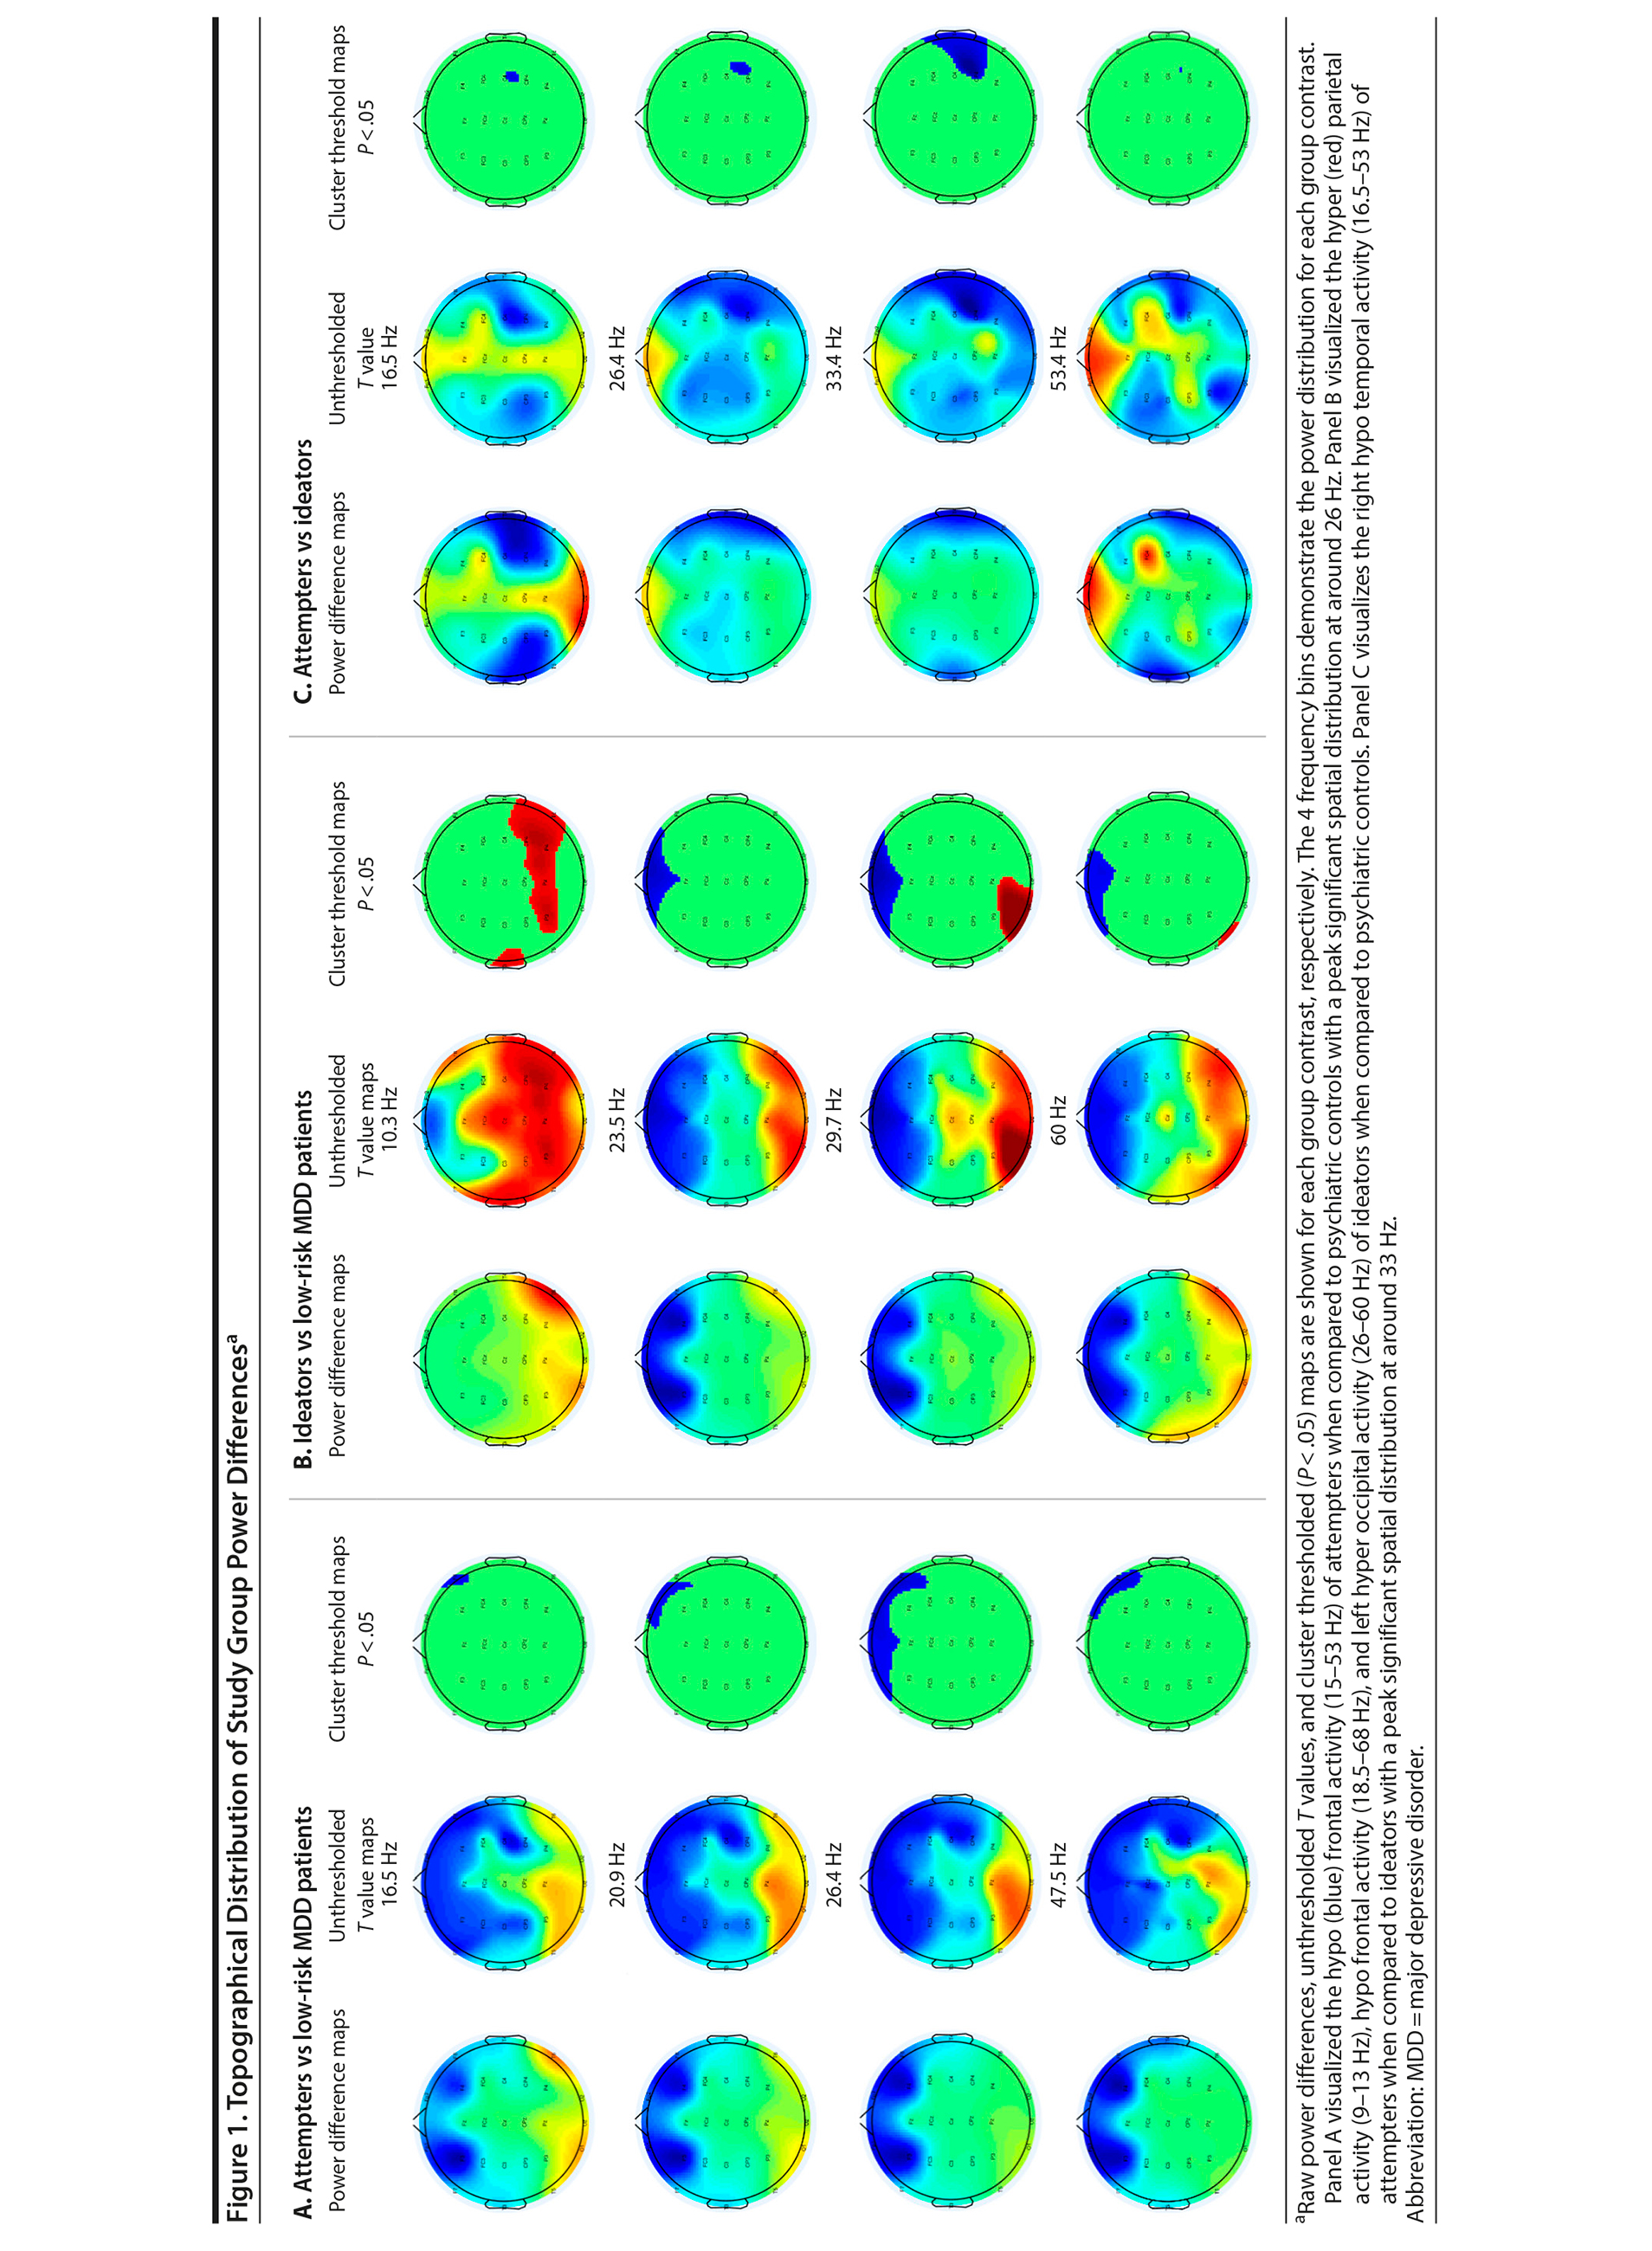
The spatial-frequency cluster multiple comparisons correction (MCC) analysis was applied as a 2-tailed test. The analysis revealed significant hypoactivity at the frontal electrodes for the attempters when compared to the low-risk controls. The hypoactivity appeared around 15 Hz in the right frontal area, reaching a bilateral spatial peak around 26 Hz until it retracted to the right frontal area up to around 53 Hz (Figure 1A [animations depicting these analyses can be viewed as Supplementary Figures 1-3 at Psychiatrist.com]). When the ideators were contrasted with the low-risk controls, significant bilateral posterior hyperactivity was observed for the ideators in the 9-13 Hz frequency range. Significant frontal hypoactivity was also observed for the ideators. This frontal hypoactivity appeared around 18.5 Hz in the right frontal area and became bilateral around 21 Hz until it retracted to the left frontal area up to around 68 Hz. Significant left occipital hyperactivity was observed as well for the ideators, starting at around 26 Hz until it dissipated at around 60 Hz (Figure 1B). The final spatial-frequency cluster MCC analysis contrasted attempters with ideators. Significant right temporal hypoactivity was detected for attempters when compared to the ideators. The right temporal hypoactivity emerged around 16.5 Hz, was maximally distributed at 33 Hz, and dissipated at around 53 Hz (Figure 1C).
Click figure to enlarge
Post Hoc ANCOVA Analysis and Effect Size
Since attempters had significantly higher BDI scores than ideators and low-risk controls, an ANCOVA was performed on the extracted power values with BDI as a covariate. The ANCOVA revealed a significant difference on EEG power between attempters and low-risk controls (F1,38 = 7.19, P = .011). A subsequent Cohen’s d calculation estimated a large effect size (d = 0.85). In addition, the ANCOVA also revealed a significant difference on EEG power between attempters and ideators (F1,51 = 4.55, P = .038). Cohen’s d estimated a medium effect size (d = 0.61). Lastly, when looking at ideators with respect to low-risk controls, Cohen’s d estimated a medium effect size (d = 0.75).
Click figure to enlarge
eLORETA Analysis
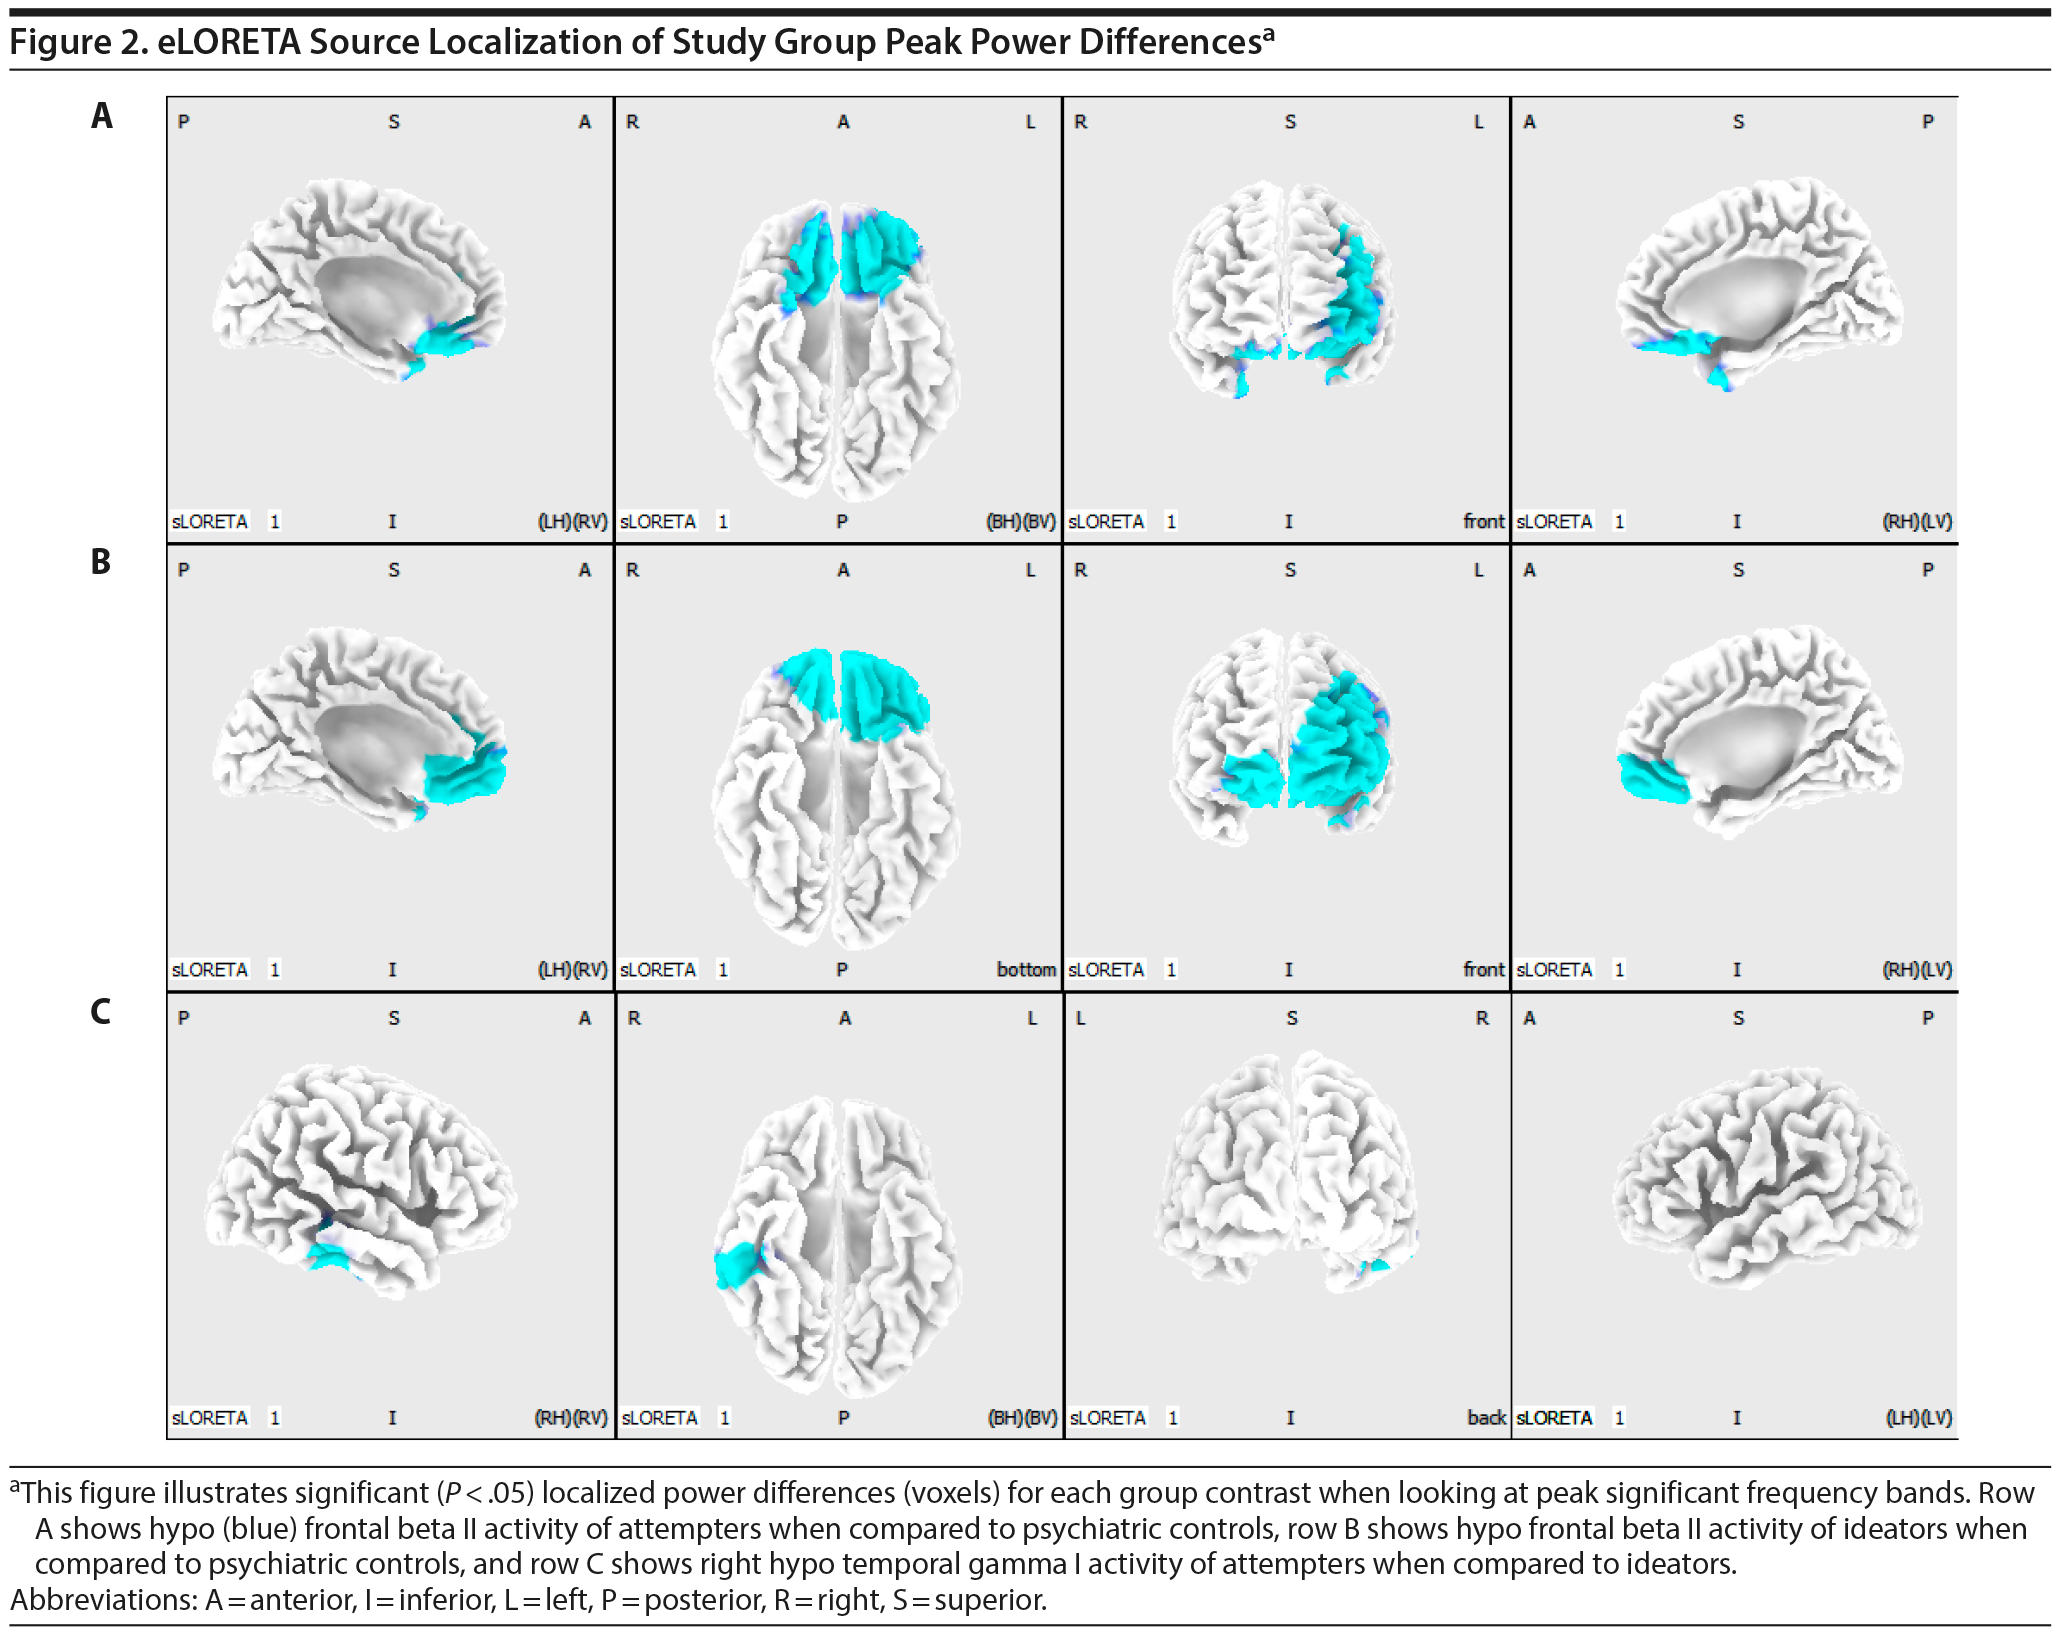
When contrasting attempters with low-risk controls, the spatial-frequency cluster MCC analysis revealed only hypoactivity. Therefore, a 1-tailed test was applied in eLORETA. The eLORETA analysis localized significant differences for the following frequency bands: beta (P = .034), beta I (P = .038), beta II (P = .027), beta III (P = .041), and gamma I (P = .036). When looking at the frequency band with the highest level of significance (beta II), eLORETA localized attempter hypoactivity within the rectal gyrus (bilateral), orbital gyrus (bilateral), medial frontal gyrus (bilateral), inferior frontal gyrus (bilateral), subcallosal gyrus (bilateral), anterior cingulate gyrus (bilateral), middle frontal gyrus (left hemisphere), and superior frontal gyrus (left hemisphere).
Since the spatial-frequency cluster MCC analysis revealed both hypo- and hyperactivity when contrasting ideators with low-risk controls, a 2-tailed test was applied in eLORETA. The eLORETA analysis localized significant differences for the following frequency bands: sensorimotor rhythm (SMR) (P = .01), beta (P = .004), beta I (P = .006), beta II (P = .005), beta III (P = .003), and gamma I (P = .011). When looking at the frequency band with the highest level of significance (beta III), eLORETA localized ideator hypoactivity within the medial frontal gyrus (bilateral), anterior cingulate gyrus (bilateral), middle frontal gyrus (bilateral), superior frontal gyrus (bilateral), inferior frontal gyrus (left hemisphere), orbital gyrus (bilateral), subgyral (left hemisphere), rectal gyrus (bilateral), and insula (left hemisphere). eLORETA did not detect any posterior hyperactivity in the alpha band or occipital hyperactivity in the beta and low gamma band.
When contrasting attempters with ideators, the spatial-frequency cluster MCC analysis revealed only hypoactivity. As a result, a 1-tailed test was applied in eLORETA. The eLORETA analysis localized (marginally) significant differences for the following frequency bands: beta III (P = .082) and gamma I (P = .043). When looking at the frequency band with the highest level of significance (gamma I), eLORETA localized attempter hypoactivity within the inferior temporal gyrus (right hemisphere), fusiform gyrus (right hemisphere), middle temporal gyrus (right hemisphere), and superior temporal gyrus (right hemisphere). Figure 2 provides a visual overview of the eLORETA analysis results. The peak MNI coordinates for each brain region can be viewed in Tables 2, 3 and 4.
Click figure to enlarge
Click figure to enlarge
DISCUSSION
Our results show that both attempters and ideators have less resting state beta and low gamma activation when compared with low-risk MDD patients, specifically in the frontal regions of the brain. eLORETA localizes these frequency power differences for both attempters and ideators within the orbito-, medial-, middle-, superior-, and inferior-frontal areas and the anterior cingulate cortex. These findings are in agreement with a coordinate-based meta-analysis of structural and functional (f)MRI studies, in which reduced gray-matter volumes of the rectal gyrus and increased reactivity of the anterior cingulate cortex have been observed.7 Additionally, a review concerning the neurobiology of suicide described lower gray-matter volume of dorsolateral prefrontal cortex (DLPFC), orbitofrontal cortex, and anterior cingulate cortex in suicide attempters when compared to psychiatric controls.8 Moreover, a recent neuromodulation study found that accelerated intermittent theta burst stimulation treatment for MDD on the left DLPFC leads to strengthened functional connectivity between the subgenual anterior cingulate cortex and the medial orbitofrontal cortex in treatment responders, which in turn corresponded with a decrease in feelings of hopelessness, a major risk factor for suicide.24 The cluster-based MCC analysis also revealed alpha hyperactivity and beta to low gamma hyperactivity for ideators when compared with low-risk controls. However, eLORETA analysis did not detect this hyperactivation, perhaps due to eLORETA’s statistical test being less sensitive (eLORETA’s Statistical nonParametric Mapping does not take cluster mass into account). Our study also contrasted attempters with ideators, revealing less right temporal beta and low gamma activation for attempters when compared to ideators. eLORETA localizes these frequency power differences within the right inferior-, middle-, and superior-temporal cortex and the fusiform gyrus. These findings corroborate those from MRI studies that investigated structural brain characteristics in a suicide attempter population.8,25 For instance, Pan and colleagues25 observed gray-matter volume reduction in the right superior temporal gyrus in a population of adolescents with a history of suicide attempt.
The preliminary analysis revealed a significant difference in BDI scores between the attempter group and the ideator and low-risk control groups. One could argue that the frequency characteristics that were found for the attempter group were driven by this difference in BDI scores. This seems unlikely, since the ideator group’s hypofrontal beta frequency characteristics are similar to those of the attempter group. The results of the post hoc ANCOVA support this notion since power differences remained significantly different when contrasting attempters with low-risk controls and ideators while BDI scores are controlled for. Nevertheless, a final analysis was performed in which the MDD patients were ranked on BDI scores from high to low. Based on these ranked BDI scores, 3 groups were constructed who were size-matched with the suicide groups (high BDI group with n = 19, medium BDI with n = 36, and low BDI with n = 23). The cluster-based MCC analysis was then performed on these 3 distinct BDI groups. No significant clusters were detected by the analysis, implying again that the EEG frequency characteristics are not driven by BDI scores.
Click figure to enlarge
It seems that suicide attempters and ideators have a general reduced frontal beta and low gamma band activity when compared to low-risk controls. Nonetheless, there is the possibility that suicide attempters and ideators have an overall predominance for lower over higher frequencies when compared to low-risk controls. To resolve this ambiguity, raw power values were aggregated over frontal electrodes (Fp1, Fp2, F3, and F4) for each study group. Figure 3 shows that power values are similar for attempters, ideators, and low-risk controls at the lower frequency spectrum but that attempters and ideators demonstrate overall lower frontal EEG power around 15-60 Hz compared to low-risk controls; confirming the initial findings of the spatial-frequency analysis.
Click figure to enlarge
Click figure to enlarge
Limitations of the current study include the reliance on post hoc data, using a sample that consists of female participants exclusively, using low-density EEG for source localization, and being restricted to use of the MINI questionnaire for suicide risk assessment. Although EEG source localization accuracy increases in function of the number of electrodes being used,26 the current study’s localizations seem to be congruent with the regions reported by functional and structural MRI studies of suicidal patients. Because of the reliance on post hoc data, only the MINI questionnaire was administered for suicide risk assessment. As a result, the study’s design was limited due to the basic format of the MINI suicide assessment subscale. It would have been interesting to examine if there are unique frequency characteristics, not only for attempters and ideators but also for individuals with concrete suicidal plans or intent. Nonetheless, the MINI questionnaire has been reported to have high predictive validity concerning suicidal behavior.27 Another limitation due to the reliance on post hoc data is the absence of measures such as impulsivity, psychological pain, and feelings of hopelessness. Impulsivity, psychological pain, and feelings of hopelessness are psychological constructs that are implicated with suicidal behaviors.8,28-30 With respect to the design of the current study, it is unclear how these constructs influence the results. A final limitation concerns the pharmacologic makeup of the study sample. The original study did not implement a washout period or a preselection of pharmacologic medications. Consequently, it is possible that the pharmacologic treatment makeup could have been different across study groups. Therefore, future research, not limited to the female sex, should try to replicate the findings of the current study while holding these limitations in mind. High density EEG systems would allow us to more accurately pinpoint the location of these frequency characteristics, revealing possible treatment sites for neuromodulation methods such as repetitive transcranial magnetic stimulation, transcranial direct-current stimulation, or EEG neurofeedback. Moreover, researchers should attempt to apply machine-learning algorithms on EEG data, analogous to the study of Just and colleagues.9 If proven to be successful, this approach would be the first step into developing a reliable and practical biomarker for suicide risk in the clinical setting.
In conclusion, the present study offers a novel perspective on suicide risk assessment by means of EEG frequency power characteristics. The findings could be considered as a benchmark for future electrophysiologic studies and may contribute toward developing a cost-effective, time-efficient, accessible, and reliable biomarker of suicidality.
Submitted: November 19, 2018; accepted May 22, 2019.
Published online: October 29, 2019.
Author contributions: All authors contributed substantially to conception and design, or acquisition of data, or analysis and interpretation of data and drafted the article or revised it critically for important intellectual content and gave final approval of the version to be published.
Potential conflicts of interest: Dr Arns reports options from Brain Resource (Sydney, Australia) and is director and owner of Research Institute Brainclinics, a minority shareholder in neuroCare Group (Munich, Germany), and a co-inventor on 4 patent applications (A61B5/0402; US2007/0299323, A1; WO2010/139361 A1) related to EEG, neuromodulation, and psychophysiology but does not own or receive any proceeds related to these patents. The other authors report no conflict of interest.
Funding/support: Research Institute Brainclinics received funding from Brain Resource (Sydney, Australia) and neuroCare Group (Munich, Germany) and equipment support from Deymed, neuroConn, and Magventure; however, data analyses and writing of this manuscript were unconstrained. This research received no grants from funding agencies in the public, commercial, or not-for-profit sectors.
Acknowledgments: The authors thank Jens Allaert, MSc; Linde De Wandel, MSc; Louise Puttevils, MSc; Matias Pulópulos Tripiana, PhD (Ghent University, Ghent, Belgium); and Tasha Poppa, MSc (University of Southern California, Los Angeles, California) for their support and assistance and for providing feedback on the writing of the manuscript. The acknowledged individuals report no conflict of interest.
Supplementary material: See accompanying pages.
REFERENCES
1.Preventing Suicide: A Global Imperative. Geneva, Switzerland: World Health Organization; 2014.
2.Hawton K, van Heeringen K. Suicide. Lancet. 2009;373(9672):1372-1381. PubMed CrossRef
3.Glenn CR, Nock MK. Improving the short-term prediction of suicidal behavior. Am J Prev Med. 2014;47(suppl 2):S176-S180. PubMed CrossRef
4.Mann JJ, Currier D, Stanley B, et al. Can biological tests assist prediction of suicide in mood disorders? Int J Neuropsychopharmacol. 2006;9(4):465-474. PubMed CrossRef
5.Nock MK, Park JM, Finn CT, et al. Measuring the suicidal mind: implicit cognition predicts suicidal behavior. Psychol Sci. 2010;21(4):511-517. PubMed CrossRef
6.Lesko LJ, Atkinson AJ Jr. Use of biomarkers and surrogate endpoints in drug development and regulatory decision making: criteria, validation, strategies. Annu Rev Pharmacol Toxicol. 2001;41(1):347-366. PubMed CrossRef
7.van Heeringen K, Bijttebier S, Desmyter S, et al. Is there a neuroanatomical basis of the vulnerability to suicidal behavior? a coordinate-based meta-analysis of structural and functional MRI studies. Front Hum Neurosci. 2014;8:824. PubMed CrossRef
8.van Heeringen K, Mann JJ. The neurobiology of suicide. Lancet Psychiatry. 2014;1(1):63-72. PubMed CrossRef
9.Just MA, Pan L, Cherkassky VL, et al. Machine learning of neural representations of suicide and emotion concepts identifies suicidal youth. Nat Hum Behav. 2017;1(12):911-919. PubMed CrossRef
10.Olbrich S, Arns M. EEG biomarkers in major depressive disorder: discriminative power and prediction of treatment response. Int Rev Psychiatry. 2013;25(5):604-618. PubMed CrossRef
11.Graae F, Tenke C, Bruder G, et al. Abnormality of EEG alpha asymmetry in female adolescent suicide attempters. Biol Psychiatry. 1996;40(8):706-713. PubMed CrossRef
12.Thompson C, Ong ELC. The association between suicidal behavior, attentional control, and frontal asymmetry. Front Psychiatry. 2018;9:79. PubMed CrossRef
13.Hunter AM, Leuchter AF, Cook IA, et al. Brain functional changes (QEEG cordance) and worsening suicidal ideation and mood symptoms during antidepressant treatment. Acta Psychiatr Scand. 2010;122(6):461-469. PubMed CrossRef
14.Iosifescu DV, Greenwald S, Devlin P, et al. Pretreatment frontal EEG and changes in suicidal ideation during SSRI treatment in major depressive disorder. Acta Psychiatr Scand. 2008;117(4):271-276. PubMed CrossRef
15.Lee SM, Jang KI, Chae JH. Electroencephalographic correlates of suicidal ideation in the theta band. Clin EEG Neurosci. 2017;48(5):316-321. PubMed CrossRef
16.van der Vinne N, Vollebregt MA, van Putten MJAM, et al. Frontal alpha asymmetry as a diagnostic marker in depression: fact or fiction? a meta-analysis. Neuroimage Clin. 2017;16:79-87. PubMed CrossRef
17.Maris E, Oostenveld R. Nonparametric statistical testing of EEG- and MEG-data. J Neurosci Methods. 2007;164(1):177-190. PubMed CrossRef
18.Pascual-Marqui RD. Discrete, 3D distributed, linear imaging methods of electric neuronal activity. Part 1: exact, zero error localization. Cornell University archives website. https://arxiv.org/ftp/arxiv/papers/0710/0710.3341.pdf. 2007.
19.Delorme A, Makeig S. EEGLAB: an open source toolbox for analysis of single-trial EEG dynamics including independent component analysis. J Neurosci Methods. 2004;134(1):9-21. PubMed CrossRef
20.Perrin F, Pernier J, Bertrand O, et al. Spherical splines for scalp potential and current density mapping. Electroencephalogr Clin Neurophysiol. 1989;72(2):184-187. PubMed CrossRef
21.Srinivasan R, Nunez PL, Tucker DM, et al. Spatial sampling and filtering of EEG with spline laplacians to estimate cortical potentials. Brain Topogr. 1996;8(4):355-366. PubMed CrossRef
22.Fingelkurts AA, Fingelkurts AA. Altered structure of dynamic electroencephalogram oscillatory pattern in major depression. Biol Psychiatry. 2015;77(12):1050-1060. PubMed CrossRef
23.Cohen MX. Analyzing Neural Time Series Data: Theory and Practice. Cambridge, MA: MIT Press; 2014.
24.Baeken C, Duprat R, Wu GR, et al. Subgenual anterior cingulate-medial orbitofrontal functional connectivity in medication-resistant major depression: a neurobiological marker for accelerated intermittent theta burst stimulation treatment? Biol Psychiatry Cogn Neurosci Neuroimaging. 2017;2(7):556-565. PubMed CrossRef
25.Pan LA, Ramos L, Segreti A, et al. Right superior temporal gyrus volume in adolescents with a history of suicide attempt. Br J Psychiatry. 2015;206(4):339-340. PubMed CrossRef
26.Song J, Davey C, Poulsen C, et al. EEG source localization: Sensor density and head surface coverage. J Neurosci Methods. 2015;256:9-21. PubMed CrossRef
27.Roaldset JO, Linaker OM, Bj׸rkly S. Predictive validity of the MINI suicidal scale for self-harm in acute psychiatry: a prospective study of the first year after discharge. Arch Suicide Res. 2012;16(4):287-302. PubMed CrossRef
28.Kuo WH, Gallo JJ, Eaton WW. Hopelessness, depression, substance disorder, and suicidality: a 13-year community-based study. Soc Psychiatry Psychiatr Epidemiol. 2004;39(6):497-501. PubMed CrossRef
29.van Heeringen K, Van den Abbeele D, Vervaet M, et al. The functional neuroanatomy of mental pain in depression. Psychiatry Res. 2010;181(2):141-144. PubMed CrossRef
30.Liu RT, Trout ZM, Hernandez EM, et al. A behavioral and cognitive neuroscience perspective on impulsivity, suicide, and non-suicidal self-injury: meta-analysis and recommendations for future research. Neurosci Biobehav Rev. 2017;83:440-450. PubMed CrossRef
Editor’s Note: We encourage authors to submit papers for consideration as a part of our Focus on Childhood and Adolescent Mental Health section. Please contact Karen D. Wagner, MD, PhD, at [email protected].
Please sign in or purchase this PDF for $40.00.
![]() Save
Save
![]() Share
Share
![]() Cite
Cite