ABSTRACT
Objective: Estimates of prevalence and burden of treatment-resistant depression (TRD) vary widely in the literature. This study evaluated the prevalence and burden of TRD and the share of TRD in the burden of medication-treated major depressive disorder (MDD) using the most commonly accepted definition of TRD and a novel bottom-up approach.
Methods: Prevalence and health care burden of TRD were estimated by synthetizing inputs across 4 similarly designed claims studies in adults covered by Medicare, Medicaid, commercial plans, and the US Veterans Health Administration (VHA). Productivity (absenteeism and presenteeism) and unemployment burden were estimated based on inputs from a study conducted with data from the Kantar National Health and Wellness Survey (NHWS; 2017). A targeted literature search for additional inputs was performed. A cost model was developed to estimate the burden of TRD and medication-treated DSM-5–defined MDD in the United States. Study outcomes were the 12-month prevalence of TRD and the annual health care, productivity, and unemployment burden of TRD and medication-treated MDD in the United States.
Results: The estimated 12-month prevalence of medication-treated MDD in the United States was 8.9 million adults, and 2.8 million (30.9%) had TRD. The total annual burden of medication-treated MDD among the US population was $92.7 billion, with $43.8 billion (47.2%) attributable to TRD. The share of TRD was 56.6% ($25.8 billion) of the health care burden, 47.7% ($8.7 billion) of the unemployment burden, and 32.2% ($9.3 billion) of the productivity burden of medication-treated MDD.
Conclusions: TRD is associated with disproportionate health care costs and unemployment, suggesting potentially large economic and societal gains with effective management.
J Clin Psychiatry 2021;82(2):20m13699
To cite: Zhdanava M, Pilon D, Ghelerter I, et al. The prevalence and national burden of treatment-resistant depression and major depressive disorder in the United States. J Clin Psychiatry. 2021;82(2):20m13699.
To share: https://doi.org/10.4088/JCP.20m13699
© Copyright 2021 Physicians Postgraduate Press, Inc.
aAnalysis Group, Inc., Montréal, Quebec, Canada
bJanssen Scientific Affairs, LLC, Titusville, New Jersey
*Corresponding author: Maryia Zhdanava, MA, Analysis Group, Inc., 1190 avenue des Canadiens-de-Montréal, Deloitte Tower, Ste 1500, Montreal, QC, H3B 0G7, Canada ([email protected]).
Major depressive disorder (MDD) is a psychiatric condition that clinically manifests through changes in mood and cognition as well as a loss of interest or pleasure lasting at least 2 weeks.1,2 Annual prevalence of a major depressive episode among US adults is 7.1%, among whom half receive medication treatment for their condition.3
Failure to respond or achieve remission after 2 or more trials of medication treatment for MDD of adequate dose and duration is typically referred to as treatment-resistant depression (TRD),4–7 but a universally accepted definition of TRD is lacking. Estimates of the prevalence of TRD vary widely in the literature (12%–55%) in part due to the lack of uniformity in the criteria used to define it.8–11
MDD and, in particular, TRD impose a substantial economic burden in the United States. Greenberg et al12 estimated the national economic burden of MDD as $210.5 billion in 2010. In a systematic literature review that defined TRD as a failure to respond to at least one adequate trial of a medication treatment, Mrazek et al13 estimated the national burden of TRD as $29–$48 billion annually, assuming that 12%–20% among all patients with depression have TRD.13 Based on that study, TRD accounted for 27%–41% of the total costs of MDD.
Recently, several studies14–17 assessed the per-person economic burden of adults with TRD from a payer perspective across various US payer types, including Medicare, Medicaid, commercial plans, and the US Veterans Health Administration (VHA) and Tricare (henceforth referred to collectively as VHA). These studies used the same definition of TRD and a similar approach to economic burden estimation, which presents an opportunity to derive a single estimate of TRD prevalence in the United States and to revisit previous estimates of the national cost burden of MDD and TRD among the US population. To build a comprehensive cost model, the present study complemented the information on the per-person health care cost associated with TRD across US payers14–17 with recently published data on absenteeism- and presenteeism-related costs as well as unemployment associated with TRD and medication-treated MDD.18
METHODS
A cost model was developed to estimate the national economic burden of TRD and medication-treated MDD in the United States.
Model Inputs
Population inputs. The study population included US adults with medication-treated MDD and was derived based on the size of the US adult population (2017),19 the annual prevalence of a major depressive episode among adults, and the proportion of adults receiving medication for a Diagnostic and Statistical Manual of Mental Disorders, Fifth Edition (DSM-5)–defined major depressive episode.3
US adults with medication-treated MDD included those with TRD and without TRD (non-TRD MDD). Incident sample sizes of adults with TRD and non-TRD MDD were leveraged from the 4 similarly designed insurance claims studies14–17 that focused on the following major national payer types in the United States: Medicare, Medicaid, commercial plans, and VHA. In these studies, MDD was defined based on ICD-9-CM and ICD-10-CM diagnosis codes in medical claims data. TRD was defined as the initiation of a third antidepressant treatment course (including augmentation therapy) after changing 2 antidepressant courses of adequate dose and duration; a treatment gap of up to 180 days was allowed between the consecutive antidepressant treatment courses. Adults with an MDD diagnosis and an antidepressant treatment were considered to have non-TRD MDD if they did not meet the aforementioned TRD criteria within 2 years of the first antidepressant claim.
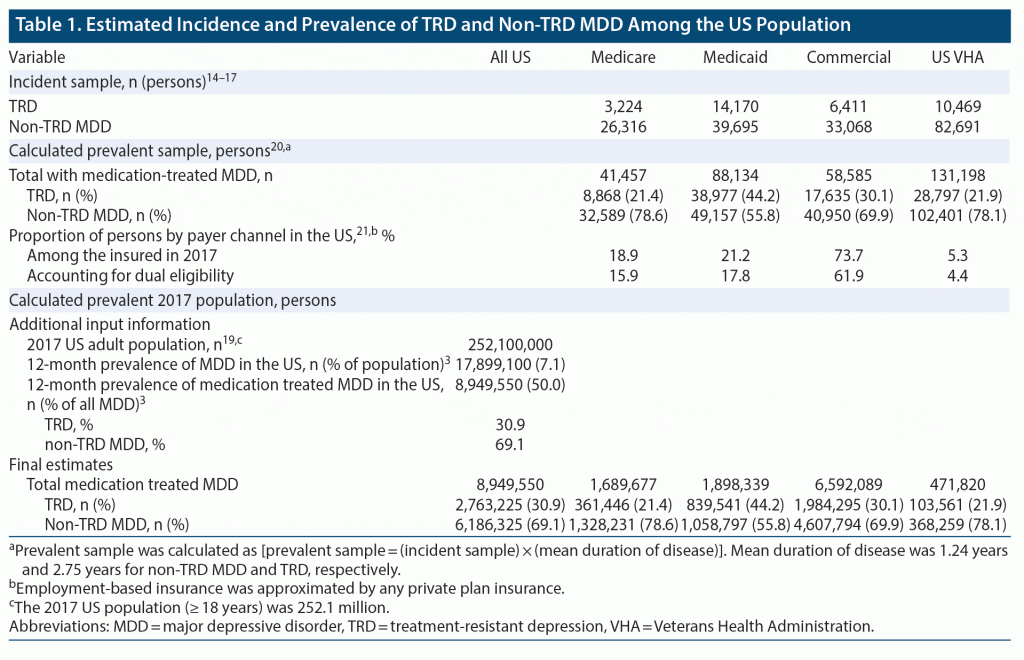
Sizes of prevalent samples of adults with TRD and non-TRD MDD by each payer type were estimated by multiplying sizes of the incident samples by the mean duration of a TRD (2.75 years) or non-TRD MDD (1.24 years) episode, as previously reported in the literature.20 The proportions of adults with TRD and non-TRD MDD were calculated among the total number of adults with medication-treated MDD in each prevalent sample. Across payers, the proportion of adults with TRD among those with medication-treated MDD ranged from 21.4% (Medicare) to 44.2% (Medicaid) in the calculated prevalent samples. These proportions were weighted by the prevalence of each payer type and adjusted for dual coverage based on the US Census Bureau data21 to obtain weighted estimates of the prevalence of TRD and non-TRD MDD in the United States.
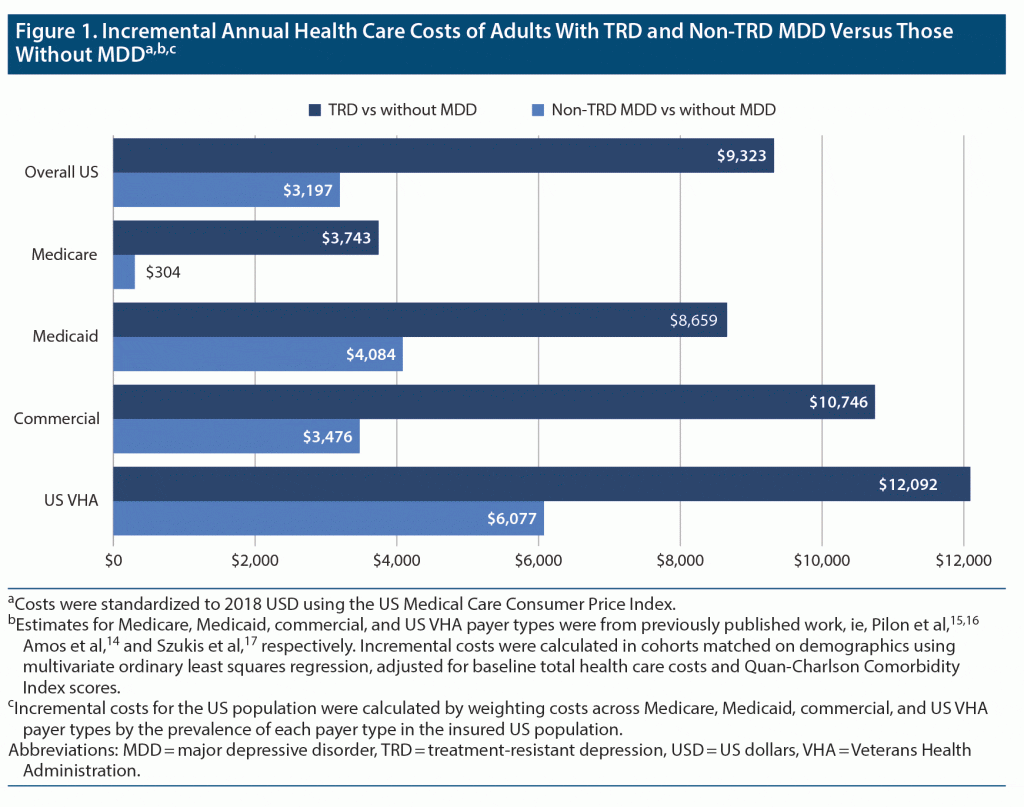
Health care cost inputs. Annual per-person health care costs of adults with TRD, with non-TRD MDD, and without MDD were obtained from the 4 insurance claims studies,14–17 each within a major national payer type, that were used for the population inputs. In these studies, patients without MDD were selected based on the absence of an MDD diagnosis. For consistency across studies, all costs were standardized to 2018 US dollars using the US Medical Care component of the Consumer Price Index (CPI; see Supplementary Table 1 for mean health care costs per payer). Mean costs were obtained in cohorts matched on demographics (those with TRD to those with non-TRD MDD and to those without MDD). Incremental costs of adults with TRD versus those with non-TRD MDD and those without MDD were obtained directly from each study, in which they were estimated using multivariate regression models adjusted for baseline costs and Quan-Charlson Comorbidity Index score.22 Incremental costs of adults with non-TRD MDD relative to those without MDD were imputed as the difference in incremental costs of TRD relative to those without MDD and those with non-TRD MDD, since this information was not directly available in the studies. Annual adjusted incremental costs of adults with TRD versus those without MDD ranged from $3,743 per person (Medicare) to $12,092 per person (VHA; Figure 1). Annual adjusted incremental costs of adults with non-TRD MDD versus those without MDD ranged between $304 (Medicare) and $6,077 (VHA) per person.
Productivity and unemployment cost inputs. Productivity and unemployment cost inputs were obtained from a study18 conducted with data from the 2017 Kantar National Health and Wellness Survey (NHWS). In that survey, MDD was defined as a self-reported clinician diagnosis of depression. TRD was defined as treatment with 2 or more medications (ie, ≥ 2 antidepressants, or ≥ 1 antidepressant and ≥ 1 antipsychotic indicated for adjunctive treatment of depression) for ≥ 3 months.
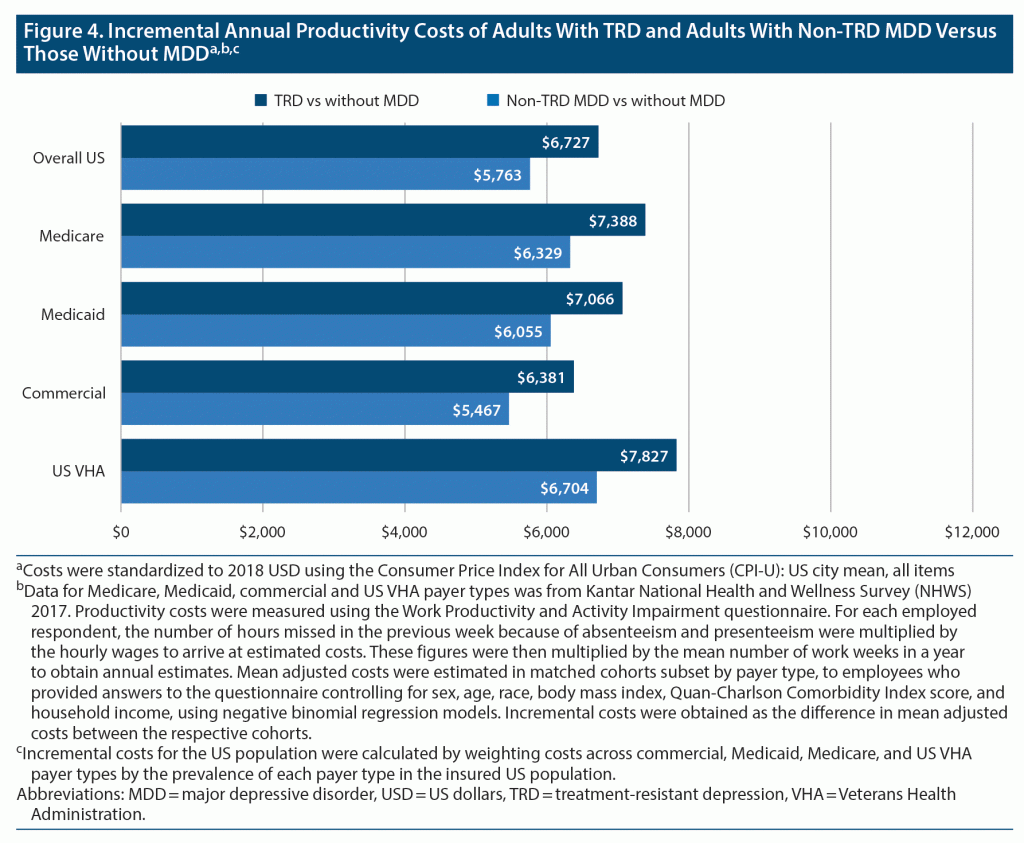
Productivity cost inputs included absenteeism and presenteeism costs among employees with TRD, those with non-TRD MDD, and those without MDD; all costs were standardized to 2018 US dollars using the CPI for All Urban Consumers (CPI-U), US city mean, all items (see Supplementary Table 2 for mean adjusted costs of absenteeism and presenteeism by payer type). Annual adjusted incremental absenteeism and presenteeism costs among employees with TRD and non-TRD MDD versus those without MDD were calculated as the difference in mean adjusted costs between respective cohorts. These costs ranged from $6,381 (commercial) to $7,827 (VHA) per person when comparing adults with TRD versus those without MDD, and from $5,467 (commercial) to $6,704 per person (VHA) when comparing adults with non-TRD MDD versus those without MDD (Figure 2).
Unemployment costs were based on the self-reported employment status from the NHWS data (see Supplementary Table 3 for mean adjusted unemployment rates by payer type). Mean adjusted incremental unemployment rates among respondents with TRD and non-TRD MDD versus those without MDD were calculated as the difference in mean adjusted unemployment rates between respective cohorts and ranged from 5.2 (Medicare) to 9.3 percentage points (Medicaid) for the comparison of adults with TRD versus adults without MDD and from 2.9 (Medicare) to 4.7 percentage points (Medicaid) for the comparison of adults with non-TRD MDD versus adults without MDD (see Supplementary Table 3).
Analyses
Annual per-person incremental health care and productivity costs, and mean adjusted incremental unemployment rates of adults with TRD and non-TRD MDD versus those without MDD were summarized across US payers, weighted by the prevalence of each payer type21 (adjusted for dual coverage). The weighted per-person health care costs across US payers were extrapolated to the prevalent populations of US adults with TRD and non-TRD MDD. The weighted per-person productivity costs across US payers were extrapolated to the prevalent populations of employees with TRD and non-TRD MDD, obtained using the weighted mean adjusted unemployment rates (see Supplementary Table 3). National incremental health care and productivity costs of adults with medication-treated MDD versus those without MDD were obtained as the sum of the incremental TRD and non-TRD MDD costs per population. National incremental unemployment costs were estimated by multiplying the weighted incremental unemployment rates by the weighted annual median per capita earnings and by the size of the respective prevalent population in the United States. Median per capita earnings for the Medicare, commercial, and VHA cohorts were obtained from the US Census Bureau 2018 data23 based on the mean age of each of these cohorts in the 4 claims studies.14–17 Median per capita earnings for the Medicaid cohort were based on the 2018 poverty threshold as published by the US Census Bureau.24 The weighted annual median per capita earnings were $39,518 per person. National incremental unemployment costs of adults with medication-treated MDD versus those without MDD were calculated as the sum of the national incremental costs of TRD and non-TRD MDD. While cost figures are presented as rounded values for clarity (eg, in billion dollars rounded to the first decimal or in dollars rounded to the nearest dollar), cost differences and proportions using these figures were calculated prior to rounding.
RESULTS
Population
The annual prevalent population of individuals with medication-treated MDD included 8.95 million adults (Table 1), of whom 2.76 million (30.9%) had TRD and 6.19 million (69.1%) had non-TRD MDD.
Health Care Costs
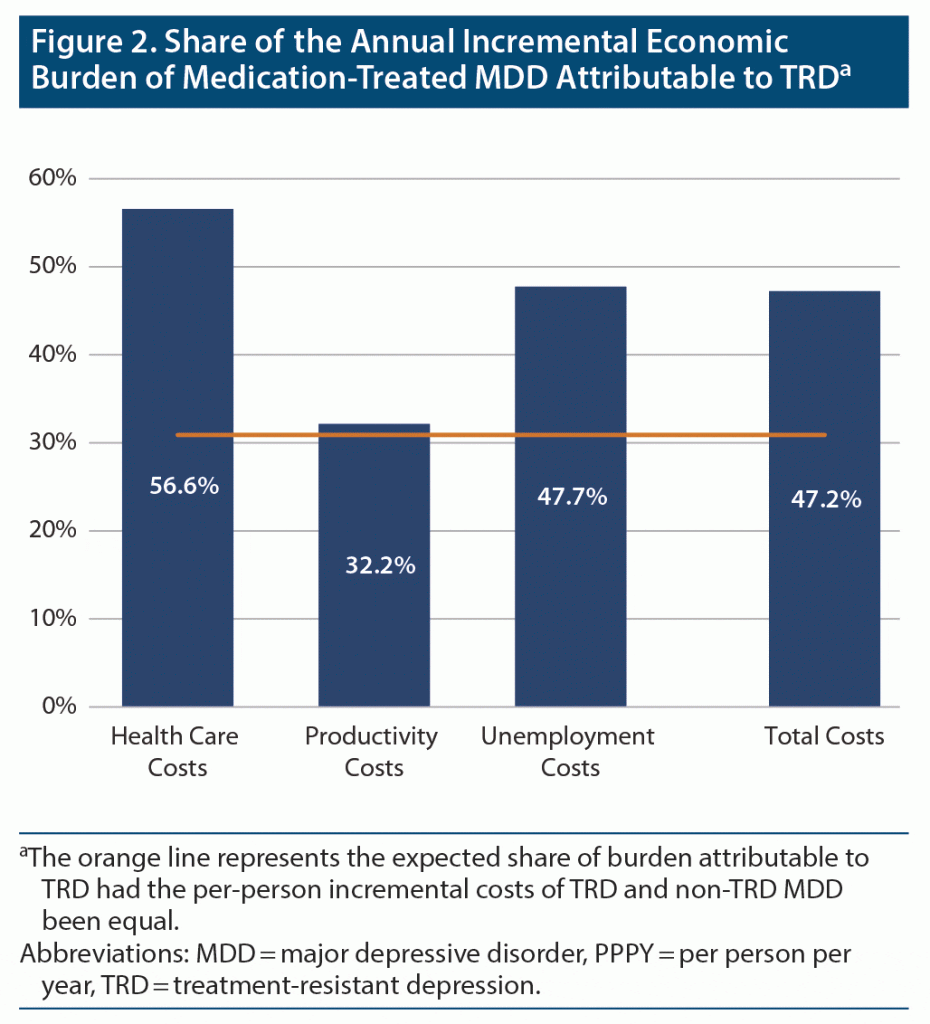
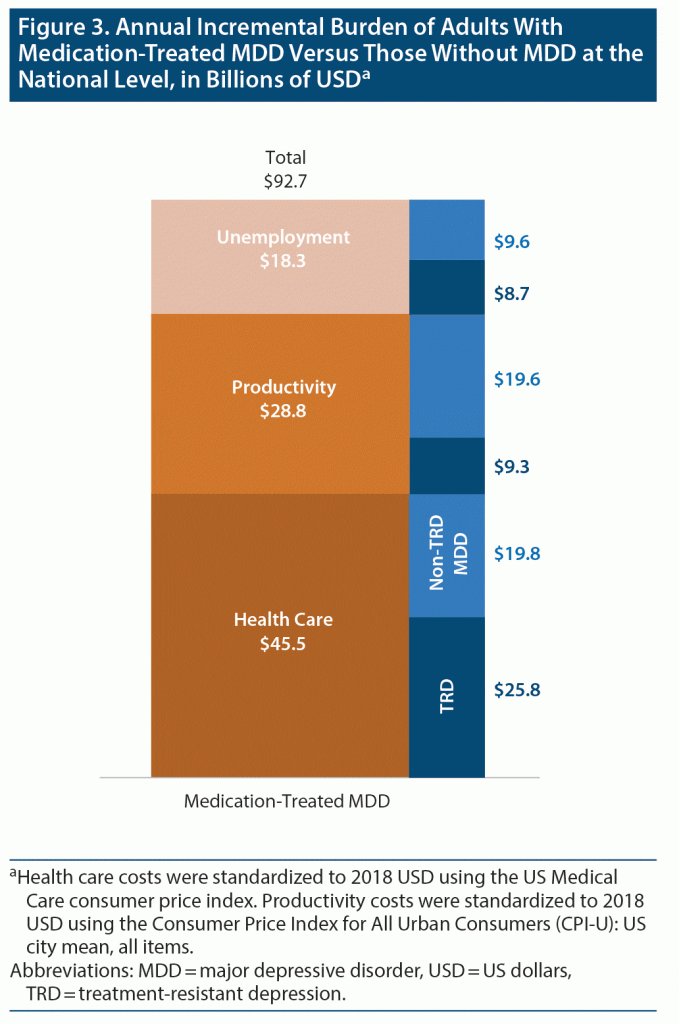
The weighted mean annual per-person incremental health care cost across US payers in adults with TRD and those with non-TRD MDD relative to those without MDD was $9,323 and $3,197, respectively (Figure 1). Extrapolated to the corresponding prevalent populations, the annual incremental health care cost burden of TRD and non-TRD MDD relative to no MDD was $25.8 billion and $19.8 billion, respectively. The annual incremental health care cost burden of adults with medication-treated MDD versus those without MDD was $45.5 billion. TRD contributed 56.6% of this cost difference, and non-TRD MDD contributed 43.4% (Figure 2 and Figure 3).
Productivity Costs
The weighted mean annual per-person incremental productivity cost across US payers in employees with TRD and those with non-TRD MDD relative to those without MDD was $6,727 and $5,763, respectively (Figure 4). Extrapolated to the prevalent populations, the annual incremental productivity cost burden of TRD and non-TRD MDD relative to no MDD was $9.3 billion and $19.6 billion, respectively. The annual incremental productivity cost burden of employees with medication-treated MDD versus those without MDD was $28.8 billion. TRD contributed 32.2% of this cost difference, and non-TRD MDD contributed 67.8% (Figure 2 and Figure 3).
Unemployment Costs
The weighted mean annual incremental unemployment rate across US payers in adults with TRD and non-TRD MDD versus those without MDD was 8.0 and 3.9 percentage points, respectively (see Supplementary Table 3). Extrapolated to the prevalent populations, the annual incremental unemployment burden of TRD relative to not having MDD was $8.7 billion and that of non-TRD MDD relative to no MDD was $9.6 billion. The annual incremental unemployment burden of adults with medication-treated MDD versus those without MDD was $18.3 billion. TRD contributed 47.7% and non-TRD MDD 52.3% of the overall unemployment burden of medication-treated MDD (Figure 2 and Figure 3).
Total Costs
The total annual incremental burden incurred by adults with medication-treated MDD relative to those without MDD was $92.7 billion, including $45.5 billion (49.1%) in health care costs, $28.8 billion (31.1%) in productivity costs, and $18.3 billion (19.8%) in unemployment costs (Figure 3). Adults with TRD accounted for $43.8 billion (47.2%) of these incremental costs (Figure 2).
DISCUSSION
In this study, the annual prevalence of TRD was estimated at 30.9% among adults with medication-treated MDD, representing 2.8 million adults or 1.1% of the US adult population. Relative to individuals without MDD, those with medication-treated MDD were estimated to incur additional costs of $92.7 billion per year. Nearly half of these costs were attributable to adults with TRD, despite this group’s representing less than a third of the total medication-treated MDD population. Health care costs constituted just under 50% of total costs, while productivity costs represented 31.1% and unemployment-related costs 19.8%.
Due to the lack of uniformity in defining TRD across studies, previous estimates of TRD prevalence in the literature vary greatly, from 12% to 55% of MDD population.8–11 This study estimated the real-world prevalence of TRD using the most common definition of TRD7,25 and accounting for the variability in the prevalence of TRD across adults covered by commercial and several government-sponsored plans. The lowest prevalence rates were observed in a Medicare population (21.4%) and the highest in a Medicaid population (44.2%). A lower prevalence of MDD has been observed among older adults26; it is possible that TRD prevalence is also lower in older adults with medication-treated MDD or that fewer Medicare-insured patients advance to further lines of antidepressant therapy due to greater concerns over drug-drug interactions or interactions between antidepressant adverse effects and comorbidities.27
The national incremental economic burden of medication-treated MDD reported in this study is lower than the previous estimate by Greenberg et al12 ($210.5 billion in 2012 US dollars). The discrepancy may be due to a number of methodological differences between the two studies. First, Greenberg et al estimated the burden of all patients with MDD in the United States, while the present study focused on patients with medication-treated MDD, who represent half of the overall MDD population.3 Next, the present study estimated unemployment-related costs, which were not included in Greenberg and colleagues’ estimate, but not the suicide-related costs. Finally, the current study leveraged original data on costs across 4 major US payer types, while Greenberg et al based their estimates on privately insured individuals.
In addition to the substantial economic burden of medication-treated MDD, findings from the current study highlight the disproportionate contribution of TRD to the overall economic burden of MDD. Adults with TRD represented less than a third of adults with medication-treated MDD, yet they accounted for nearly half of the total incremental cost burden associated with this condition due to a per-person burden approximately two times greater than that of non-TRD MDD. The proportions of health care costs (56.6%) and unemployment costs (47.7%) attributable to TRD were particularly high relative to the size of the TRD population among individuals with medication-treated MDD. Specific factors that may contribute to higher costs include medical and pharmacy costs associated with repeated treatment trials as well as depression-related exacerbation of physical health conditions as a consequence of MDD, lower productivity among working adults, and higher unemployment.13
Limitations
Limitations of this study include the extrapolation of the mean incremental costs of the insured population to the uninsured population. The estimate generated does not quantify several important elements that contribute to the wider societal burden of MDD, such as quality-of-life and caregiver burden, life-years lost, and out-of-pocket costs paid by patients. The components included are most relevant to payers, employers, and policy makers. Symptom burden was not available in the claims database studies used as inputs, and proxy definitions based on treatment patterns were used. The proxy definitions were consistent with the most common definition of TRD. In the absence of a single data source, this study relied on original estimates from several claims and survey studies, which used different methodologies, as well as the literature. However, the 4 claims-based studies used similar definitions of TRD. The relative share of TRD versus non-TRD MDD subgroups in the population of adults with medication-treated MDD in the United States was determined assuming that the ratio of major depressive episode duration in adults with TRD versus non-TRD MDD is consistent across insurance channels.
CONCLUSION
This study offers a novel bottom-up approach to the estimation of the 12-month US prevalence of TRD and the economic burden of MDD and TRD leveraging real-world data from the 4 major national payer types. With a commonly used definition of TRD applied consistently across claims databases, the real-world prevalence of TRD was estimated as 30.9% of all adults with medication-treated MDD and about 1.1% of the US adult population. The national economic burden of TRD was estimated as $43.8 billion annually and accounted for 47.2% of the burden of medication-treated MDD. The findings of this study suggest that TRD is a disproportionately burdensome condition, and its effective management could potentially bring large economic and societal gains.
Submitted: September 17, 2020; accepted February 4, 2021.
Published online: March 16, 2021.
Author contributions: Ms Zhdanava, Dr Sheehan, Mr Pilon, Ms Ghelerter, Dr Chow, Ms Joshi, and Mr Lefebvre contributed to the design of the study and interpretation of the data. Ms Zhdanava, Mr Pilon, and Ms Ghelerter contributed to the data collection and data analysis. All authors critically revised the draft manuscript and approved the final content.
Potential conflicts of interest: Mss Zhdanava and Ghelerter and Messrs Pilon and Lefebvre are employees of Analysis Group, Inc., a consulting company that has provided paid consulting services to Janssen Scientific Affairs, LLC, to conduct this study. Drs Chow and Sheehan and Ms Joshi are employees and stockholders of Johnson & Johnson.
Funding/support: This study was supported by Janssen Scientific Affairs, LLC.
Role of the sponsor: The study sponsor was involved in the study design, interpretation of results, manuscript preparation, and publication decisions.
Acknowledgments: Medical writing assistance was provided by Samuel Rochette, PhD, an employee of Analysis Group, Inc., which provided paid consulting services to Janssen Scientific Affairs, LLC, to conduct this study.
Supplementary material: Available at Psychiatrist.com
CLINICAL POINTS
- Estimates of prevalence and burden of treatment-resistant depression (TRD) vary widely depending on definitions of TRD and characteristics of patients analyzed.
- This study offers new comprehensive estimates obtained with the most commonly used definition of TRD and data from all US payer types.
- Effective management of TRD, a disproportionately burdensome condition, may bring large economic and societal gains.
References (27)

- American Psychiatric Association. Diagnostic and Statistical Manual for Mental Disorders. Fifth Edition. Washington, DC: American Psychiatric Association; 2013.
- Otte C, Gold SM, Penninx BW, et al. Major depressive disorder. Nat Rev Dis Primers. 2016;2(1):16065. PubMed CrossRef NLM
- Major Depression. National Institute of Mental Health. 2019. Accessed November 28, 2019. https://www.nimh.nih.gov/health/statistics/major-depression.shtml
- Parikh RM, Lebowitz BD. Current perspectives in the management of treatment-resistant depression. Dialogues Clin Neurosci. 2004;6(1):53–60. PubMed CrossRef NLM
- Ruhé HG, van Rooijen G, Spijker J, et al. Staging methods for treatment resistant depression: a systematic review. J Affect Disord. 2012;137(1–3):35–45. PubMed CrossRef NLM
- McIntyre RS, Filteau MJ, Martin L, et al. Treatment-resistant depression: definitions, review of the evidence, and algorithmic approach. J Affect Disord. 2014;156:1–7. PubMed CrossRef NLM
- Gaynes BN, Asher G, Gartlehner G, et al. AHRQ Technology Assessments. In: Definition of Treatment-Resistant Depression in the Medicare Population. Rockville, MD: Agency for Healthcare Research and Quality (US); 2018.
- Wiles N, Thomas L, Abel A, et al. Clinical effectiveness and cost-effectiveness of cognitive behavioural therapy as an adjunct to pharmacotherapy for treatment-resistant depression in primary care: the CoBalT randomised controlled trial. Health Technol Assess. 2014;18(31):1–167, vii–viii. PubMed CrossRef NLM
- Nemeroff CB. Prevalence and management of treatment-resistant depression. J Clin Psychiatry. 2007;68(suppl 8):17–25. PubMed NLM
- Rush AJ, Trivedi MH, Wisniewski SR, et al. Acute and longer-term outcomes in depressed outpatients requiring one or several treatment steps: a STAR*D report. Am J Psychiatry. 2006;163(11):1905–1917. PubMed CrossRef NLM
- Corey-Lisle PK, Birnbaum HG, Greenberg PE, et al. Identification of a claims data “signature” and economic consequences for treatment-resistant depression. J Clin Psychiatry. 2002;63(8):717–726. PubMed CrossRef NLM
- Greenberg PE, Fournier AA, Sisitsky T, et al. The economic burden of adults with major depressive disorder in the United States (2005 and 2010). J Clin Psychiatry. 2015;76(2):155–162. PubMed CrossRef NLM
- Mrazek DA, Hornberger JC, Altar CA, et al. A review of the clinical, economic, and societal burden of treatment-resistant depression: 1996-2013. Psychiatr Serv. 2014;65(8):977–987. PubMed CrossRef NLM
- Amos TB, Tandon N, Lefebvre P, et al. Direct and indirect cost burden and change of employment status in treatment-resistant depression: a matched-cohort study using a US commercial claims database. J Clin Psychiatry. 2018;79(2):17m11725. PubMed CrossRef NLM
- Pilon D, Sheehan JJ, Szukis H, et al. Medicaid spending burden among beneficiaries with treatment-resistant depression. J Comp Eff Res. 2019;8(6):381–392. PubMed CrossRef NLM
- Pilon D, Joshi K, Sheehan JJ, et al. Burden of treatment-resistant depression in Medicare: a retrospective claims database analysis. PLoS One. 2019;14(10):e0223255. PubMed CrossRef NLM
- Szukis H, Benson C, Huang A, et a 2018. Economic Burden of Illness Among US Veterans With Treatment-resistant Depression. Poster presented at the 2018 ASHP Summer Meeting; 2018; Denver, CO.
- Will O, Lee L, Chow W. Effect of Depression on Work Productivity Costs and Employment. Poster presented at Virtual ISPOR 2020; 2020.
- ACS 1-year Estimates Subject Tables. ACS Demographics and Housing Estimates. Table ID DP05. United States Census Bureau. Accessed December 17 2019. https://data.census.gov/cedsci/table?q=2017%3A%20ACS%201-Year%20Estimates%20Subject%20Tables&tid=ACSDP1Y2017.DP05&hidePreview=false
- Kubitz N, Mehra M, Potluri RC, et al. Characterization of treatment resistant depression episodes in a cohort of patients from a US commercial claims database. PLoS One. 2013;8(10):e76882. PubMed CrossRef NLM
- Berchick ER, Hood E, Barnett JC. Health Insurance Coverage in the United States: 2017. United States Census Bureau. 2017. Accessed December 17, 2019. https://www.census.gov/library/publications/2018/demo/p60-264.html
- Quan H, Sundararajan V, Halfon P, et al. Coding algorithms for defining comorbidities in ICD-9-CM and ICD-10 administrative data. Med Care. 2005;43(11):1130–1139. PubMed CrossRef NLM
- Labor Force Statistics (CPS). United States Census Bureau. Accessed August 24. https://www.bls.gov/cps/cps_aa2018.htm
- Poverty Thresholds. United States Census Bureau. Accessed December 17 2019. https://www.census.gov/data/tables/time-series/demo/income-poverty/historical-poverty-thresholds.html
- Brown S, Rittenbach K, Cheung S, et al. Current and common definitions of treatment-resistant depression: findings from a systematic review and qualitative interviews. Can J Psychiatry. 2019;64(6):380–387. PubMed CrossRef NLM
- Hasin DS, Sarvet AL, Meyers JL, et al. Epidemiology of adult DSM-5 major depressive disorder and its specifiers in the United States. JAMA Psychiatry. 2018;75(4):336–346. PubMed CrossRef NLM
- Bradley B, Backus D, Gray E. Depression in the older adult: what should be considered? Ment Health Clin. 2016;6(5):222–228. PubMed CrossRef NLM
This PDF is free for all visitors!
Save
Cite
