All clinicians should keep up with the latest research. It’s the best way to stay current on guidelines, changes to treatment, breakthroughs, and just about every other aspect of medicine.
But diving into a study requires you to recall everything you learned in those long ago stats classes. Do you remember what all those numbers mean? Or has it gotten a bit fuzzy?
Fortunately, The Journal of Clinical Psychiatry publishes an ongoing series of statistics refreshers written by Chittaranjan Andrade, MD, senior professor in the department of clinical psychopharmacology and neurotoxicology at the National Institute of Mental Health and Neurosciences, Bangalore, India. These excellent primers are the perfect guide to understanding the statistical analysis you often encounter in scientific papers.
Below, we’ve illustrated some of Andrade’s work to help you keep the terminology straight. For more in-depth explanations, visit the JCP‘s Research Methods Statistics page.
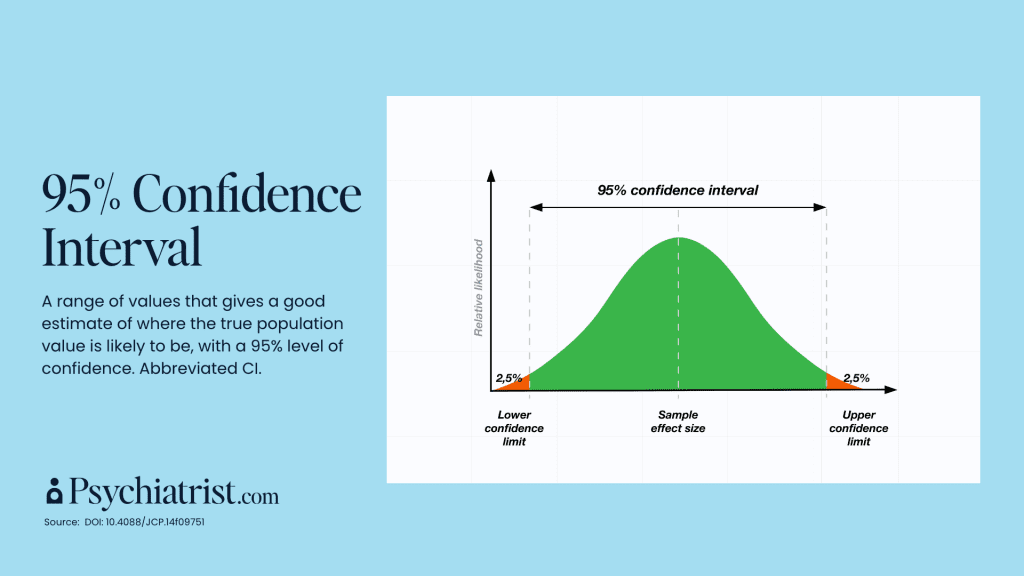
95% Confidence Ratio
“CIs are far more informative than, say, mere P values when drawing conclusions about a result,” Andrade wrote in A Primer on Confidence Intervals in Psychopharmacology. “In clinical trials, 95% CIs can provide an understanding of the possible magnitude of an effect, its statistical significance, and even its clinical significance.”
Odds Ratio
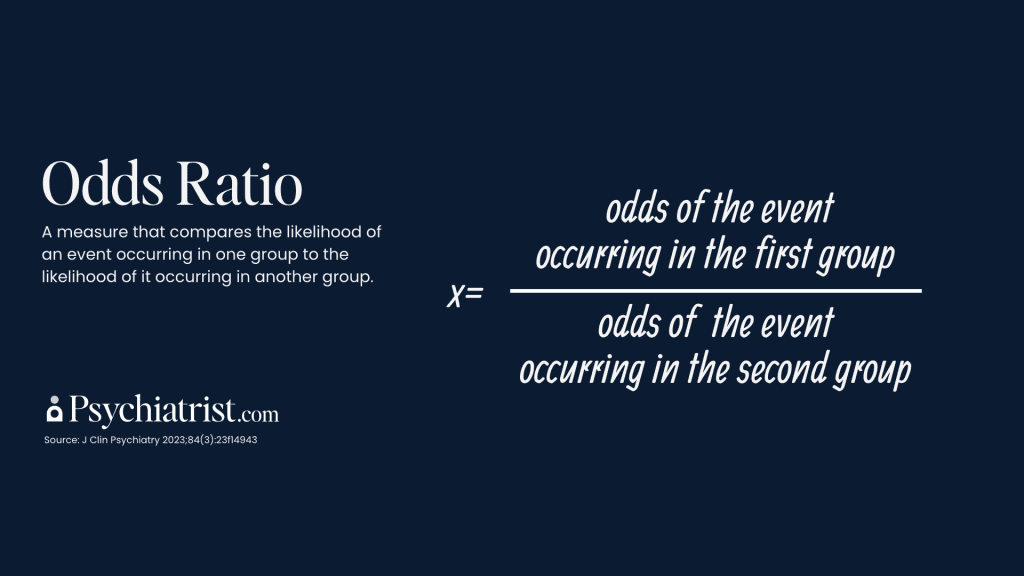
“The odds ratio is the odds of an event in an experimental group relative to that in a control group. Many research papers present findings as odds ratios as a measure of effect size for categorical outcomes,” Andrade wrote.
Hazard Ratio
According to Andrade, hazard is different from risk in that it implies a time-to-event analysis. “That is, it implies that we’re interested in finding out not just whether an event (such as relapse) occurred but how early or late it occurred,” he wrote in a recent JCP paper.
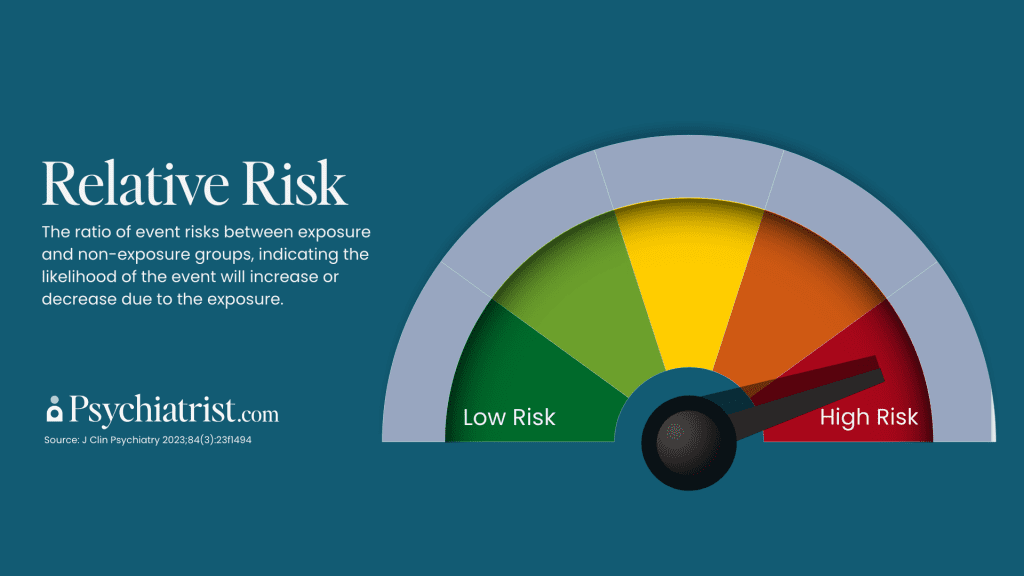
Relative Risk
“An RR of 1.00 means that the risk of the event is identical in the exposed and control samples. An RR that is less than 1.00 means that the risk is lower in the exposed sample. An RR that is greater than 1.00 means that the risk is increased in the exposed sample,” Andrade explained in a recent writeup.
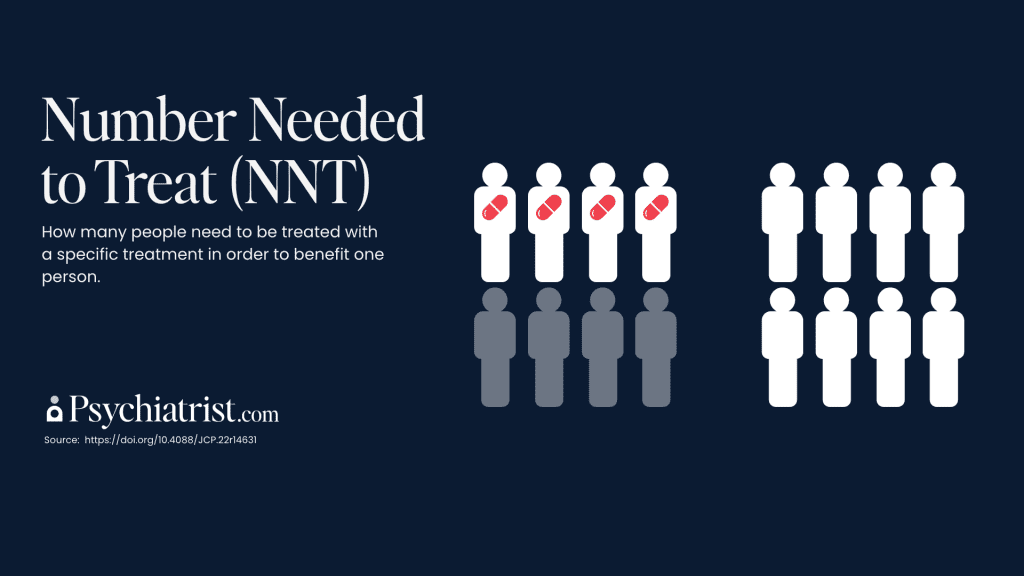
Number Needed to Treat
The number needed to treat, often abbreviated as NNT, is a derived statistic. It tells us how many patients must receive a particular treatment for 1 additional patient to experience a favorable outcome such as treatment response. Andrade underscored the importance of what NNT is and is not. For example, an NNT = 9 does not mean that treatment will result in a response rate of 1 in 9. In fact, it will result in several out of 9 patients responding. However, some of these responders would have responded anyway, through a placebo mechanism.
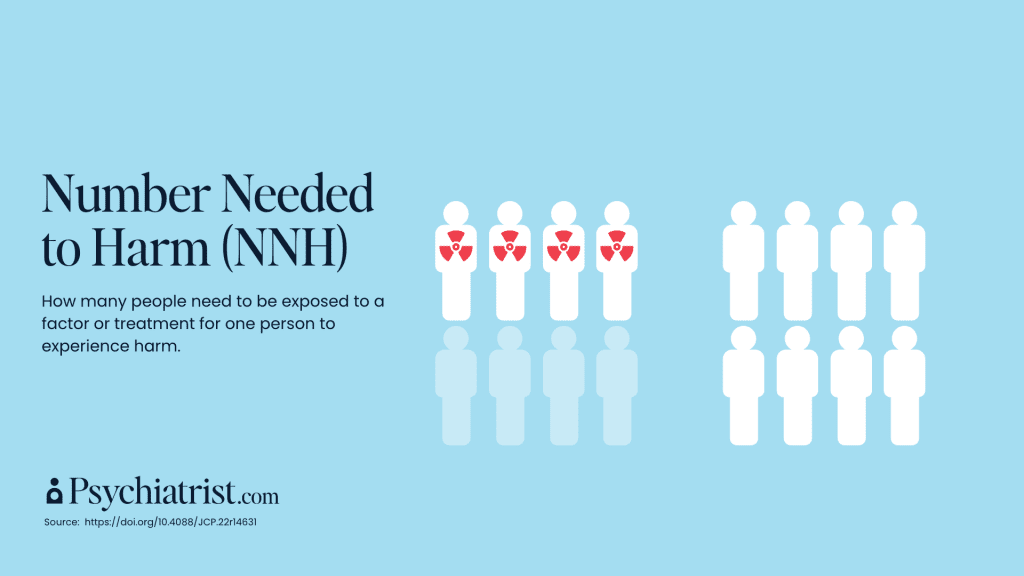
Number Needed to Harm
The number needed to harm, or NNH, derives from the observed adverse effect rates. A particular intervention treats a specific number of patients, resulting in one additional patient experiencing a specified adverse outcome. It demonstrates the number of patients who require treatment for this outcome.
Likelihood to Be Helped or Harmed
Finally, the statistic called likelihood to be helped or harmed (LLH.) This ratio is a measure of the unique association of a treatment with a favorable outcome versus its unique association with an unfavorable outcome, Andrade explained. Unique association is the risk difference for an outcome between treatment and placebo. A favorable outcome is usually response to or remission with treatment. An unfavorable outcome is usually drop out due to adverse events. Larger values for LLH imply more favorable treatment results.
